
Spatiotemporal variation in forest net ecosystem productivity and its responses to climatic factors in the water source area of the Middle Route of the South-to-North Water Diversion Project
-
摘要:
南水北调中线工程水源地(以下简称水源地)的固碳能力(净生态系统生产力,NEP)与气候变化密切相关。本文利用第二代基于个体树木的森林生态系统碳循环模型——FORCCHN2估算了水源地2002-2020年的森林NEP,并分析了森林NEP的时空变化特征及其影响因素。结果显示:2002-2020年水源地森林NEP在像元尺度上平均值为308.88~761.22 g C·m−2·a−1,辐射和温度变化是其主要影响因素。水源地森林NEP在19年间呈显著下降趋势,年均降低值为4.41 g C·m−2·a−1,且空间变化趋势具有差异性。分析总初级生产力(GPP)、土壤呼吸(SR)、植被呼吸(VR)年际变化趋势及其与气候要素的逐像元相关性,结果表明,区域东部温度上升造成的SR增长速率高于GPP;另外,西北与西南区域太阳辐射的降低导致了该区域GPP的减少。
-
关键词:
- 南水北调中线工程水源地 /
- 森林净生态系统生产力 /
- FORCCHN2 /
- 气候变化
Abstract:The carbon sequestration capacity of the water source area of the Middle Route of the South-to-North Water Diversion Project (hereinafter referred to as the water source area) is strongly influenced by climate variability. This study employed FORCCHN2, a second-generation individual-based forest ecosystem carbon cycling model, to estimate forest net ecosystem productivity (NEP) in the water source area from 2002 to 2020 and to assess its spatiotemporal dynamics and key driving factors. Results indicated that from 2002 to 2020, the average pixel-scale forest NEP ranged from 308.88 to 761.22 g C·m−2·a−1, with radiation and temperature identified as primary determinants. Over this period, NEP exhibited a significant downward trend, decreasing at an average annual rate of 4.41 g C·m−2·a−1, with spatial heterogeneity in this decline. Pixel-based correlation analysis of interannual variations in gross primary productivity (GPP), soil respiration (SR), and vegetation respiration (VR), along with their associations with climate factors, revealed that in the eastern region, rising temperatures led to a higher SR increase relative to GPP. Additionally, reductions in solar radiation in the northwest and southwest regions contributed to GPP decline in these areas.
-
人类活动的影响使大气、海洋和陆地显著变暖[1]。森林约占陆地面积的三分之一,是陆地生态系统的重要组成部分,其固定的碳约占陆地生物圈碳储存量的一半[2]。更重要的是,森林生态系统通过吸收和储存大气CO2,在碳汇方面发挥重要作用,对于缓解全球变暖具有不可忽视的意义。以往研究一般使用净生态系统生产力(NEP)表示生态系统的碳净储存量,反映森林生态系统与大气系统之间的CO2交换量[3]。NEP对气候变化敏感,会随着气候因素的变化发生时空异质性的改变[4]。然而,未来气候变化条件下,森林NEP如何响应尚不清楚。因此,通过实验观测或模型模拟来准确地评估森林生态系统NEP与气候的关系对于陆地生态系统碳循环研究具有重要意义。
目前,国内外开展森林生态系统碳汇估算方法主要有:样地清查法、涡度相关法、碳同化反演法和模型模拟法[5]。近年来,基于过程的生态模型模拟方法,具有可定量区分不同驱动因子对陆地碳汇变化的贡献,可预测陆地碳汇未来变化,并可开展长时间序列指定区域生态系统碳汇评估等优点,已成为区域或全球森林碳汇评估的主要手段。目前已有多种估算陆地生态系统NEP时空变化的生态模型,不同模型在原理、结构和参数上存在差别,导致在评估中存在很大的不确定性[6]。国内外对NEP的研究主要借助CASA和TEC模型,且集中在对其时间动态、影响因素及不确定性的分析,认为气温、降水、太阳辐射以及人类活动等因素是NEP变化的主要驱动因子[7-12]。近20年中国陆地生态系统NEP的年平均值为42.79~61.91 g/m2,呈上升趋势,并表现出明显的空间分异特征,碳汇作用占68.83%,主要集中在东北、华东、华南和华中地区[9]。中国陆地生态系统的整体碳汇能力呈增加趋势,各区域时间变化不一[10]。如,榆林地区荒漠生态系统的碳汇能力在2000-2020年呈增加趋势,2001年之前为碳源,2001年后变为碳汇;2000-2020年碳储量呈增加趋势[13];渭河流域在2001-2020年间也呈显著增加趋势[8]。2000年以来黄河流域年均NEP为92.7 g/m2,总体上表现为碳汇;NEP总体呈增加趋势,其中62.4%的地区增加趋势达到显著水平,植被固碳能力提升明显[11]。从气象因子来看,温度、降水和太阳辐射是影响NEP的主要驱动因子[14]。据报道,荒漠生态系统21年来碳汇能力的显著增强主要是由降水引起的[12]。近20年来,我国陆地生态系统NEP碳汇能力持续上升,降水与太阳辐射是其主要影响因素[9]。曹云等[11]在对黄河流域净生态系统生产力驱动因素的分析中发现,NEP多与降水呈正相关,与日照时数呈负相关,且降水的影响范围超过日照时数。
由于综合校准和验证数据的可用性不足,关于气候对森林碳循环影响的大规模研究往往依赖于生态系统过程模型,从而将经验模型限制在野外测量的地块级别上,在区域或全球尺度上具有不确定性[15, 16]。考虑到植被物候和相关生长过程,基于叶物候和生长过程的森林生态系统碳通量过程模型FORCCHN2(FORest Ecosystem Carbon Budget Model For CHiNa version 2.0)被广泛应用。在北美进行测试时,与其他6个模型相比,该模型降低了不确定性,且提高了GPP的预测性能[17]。该模型已广泛应用于区域森林生态系统的碳收支模拟,且模拟效果得到了观测数据验证[18-20]。
本研究以南水北调中线工程水源地(以下简称水源地)为对象,研究区包括退耕还林(草)计划、天然林保护以及水土保持等生态建设工程[21],生态服务功能突出。森林覆盖率高,主要以落叶阔叶林和年轻森林为主,对该地区水源涵养能力和生态安全具有重要作用。目前在水源地已经开展了部分研究,但主要集中在植被覆盖变化[22]、径流变化[23]、土地利用格局[24]、水土流失效应[25]、水质变化[26]等方面,关于森林固碳功能变化及其气候响应机制的报道很少。本文利用第二代基于个体树木的森林生态系统碳循环模型FORCCHN2.0估算水源地2002-2020年植被的NEP、GPP、土壤呼吸(Soil Respiration,SR)、植物呼吸(Vegetation Respiration,VR),并分析森林NEP的时空变化特征,同时,探讨气温、降水、辐射等气候因子对NEP、GPP、SR、VR的影响,以揭示森林生态系统生产力变化的影响因素。研究结果旨在为水源地森林生态系统的固碳能力评估以及应对气候变化的政策制定提供科学依据。
1. 材料与方法
1.1 研究区概况
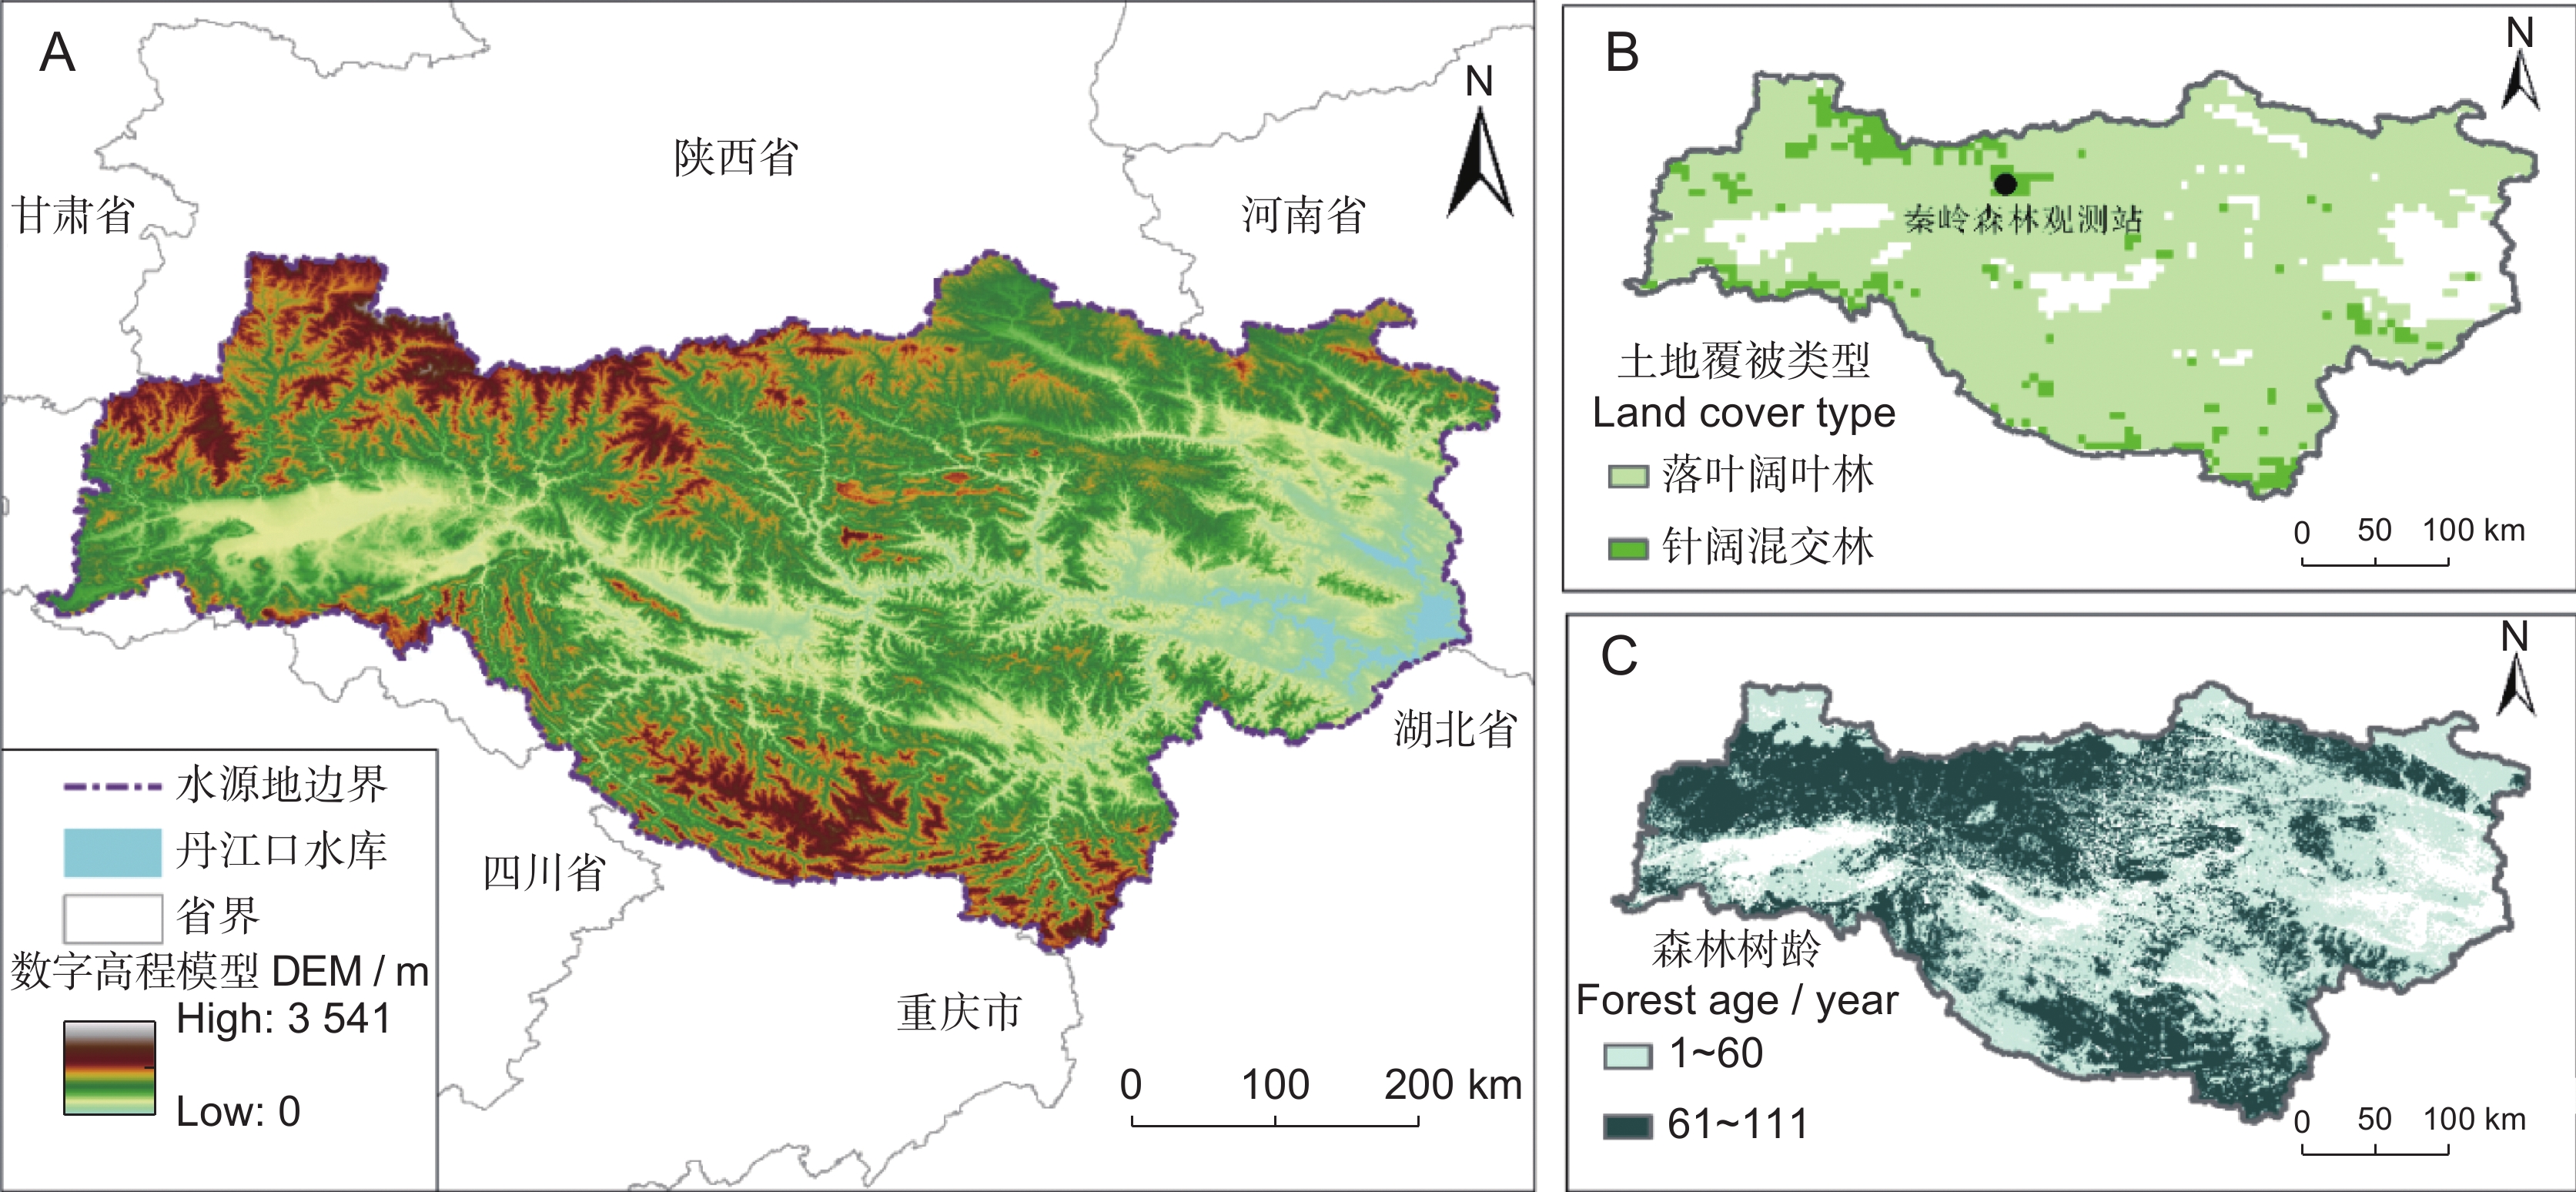
南水北调中线工程水源地位于(31°70′~34°10′N,105°50′~112°10′E)秦岭山脉与大巴山山脉之间,涵盖湖北西北部、陕西东南部、河南西南部等3省44个县市,总面积9.52万km2,海拔为100~3 177 m[27](图1)。研究区属北亚热带季风气候区,年平均降水量923 mm,降水年际变化较大,空间分布不均匀,75%的降水发生在5−10月[23]。年平均气温为14 ℃~16 ℃,最冷季和最热季平均温度分别为2.4 ℃和28.4 ℃。研究区主要包括汉江和丹江两大流域,地貌由山地、丘陵、平原组成[28]。水源地西部和南部植被以森林为主,自然植被主要有常绿针叶林、落叶阔叶林和混交林等,植被覆盖度较高,是南水北调中线工程的水源涵养区[21]。
![]() 图 1 研究区域高程(A)、土地覆盖类型(B)与树龄(C)非森林区域被掩膜为白色。底图审图号为GS(2020)4619,下同。Figure 1. Elevation (A), land cover types (B), and forest age (C) of the study areaNon-forest cover areas are masked in white. Map review number is GS (2020) 4619, same below.
图 1 研究区域高程(A)、土地覆盖类型(B)与树龄(C)非森林区域被掩膜为白色。底图审图号为GS(2020)4619,下同。Figure 1. Elevation (A), land cover types (B), and forest age (C) of the study areaNon-forest cover areas are masked in white. Map review number is GS (2020) 4619, same below.1.2 数据来源
土地覆盖使用MODIS的MCD12Q1数据,该数据集包含17个主要土地覆盖类型,包括11个自然植被类型,3个土地开发和镶嵌地类,以及3个非草木土地类型定义类(https://modis.gsfc.nasa.gov/data/dataprod/mod12.php)。数字高程模型数据(DEM)来源于谷歌地球引擎(GEE)NASA NASADEM Digital Elevation 30 m产品(https://code.earthengine.google.com/9de757ff2bb2ef83b79db2d1181ef544)。叶面积指数(LAI)数据提取自全球陆地表面卫星(GLASS)产品(http://www.glass.umd.edu/Download.html)。气象数据包括每日最高、最低和平均气温(℃)、降水量(mm)、风速(m/s)、太阳总辐射量(W/m2)、相对湿度(%)和大气压(hPa),数据来源于ERA5数据集(https://cds.climate.copernicus.eu/cdsapp#!/dataset/reanalysis-era5-land?tab=overview)。土壤质地类型数据来源于世界土壤数据库(HWSD,Harmonized World Soil Database),该数据提供了各个格网点的土壤类型、土壤相位、土壤理化性质等信息(http://www.fao.org/soils-portal/soil-survey/soil-maps-and-databases/harmonized-world-soil-database-v12/en/)。通量验证数据来自秦岭森林生态系统国家野外科学观测研究站(50°56′16″N,121°30′38″E,海拔2 150 m),该站代表了暖温带云杉林生态类型[29]。林龄来自于中国2020年30 m林龄数据集[30]。为方便后续分析,所有数据(除DEM)均重采样至0.05°地理分辨率。
1.3 模型介绍与运行
本文使用的FORCCHN2为基于个体生长过程的中国森林生态系统碳收支模型FORCCHN的第二代模型,耦合了树木的非结构性碳水化合物库(Non-structural carbohydrates,NSC),并将叶物候和相关生长过程加入到了框架内[10]。该模型由每日气象条件驱动逐个计算一定面积斑块上每株树木的碳收支,通过求和及耦合土壤碳循环模型所计算的土壤碳收支,得到生态系统在单位面积上的碳收支。模型建立在两个不同的时间尺度上,包括每日和年度过程。日常过程由光合作用、植物呼吸、光合产物分配、凋落物产生以及土壤呼吸和转移组成[31]。模型假设每日光合作用所产生的碳用于叶和细根的生长,呼吸作用所需消耗的碳以及多余碳的进行储存。光合作用采取与光照条件有关的光饱和曲线进行模拟,生长速率由静态参数决定,呼吸作用包括维持呼吸(RM)和生长呼吸(RG)(即VR=RG+RM)。年度过程则分为林分同化、树高和胸径形式的生长以及粗木屑的生产。上一年储存的碳和当年树木碳的年净增加量用于木质部分茎和枝的尺寸生长,以维持树木对有利资源的竞争,剩余部分的碳被存入NSC库。当产生和储存的碳不足以树木的生长和呼吸时,模型认为树木已经死亡。死亡的树木最终通过凋落作用加入土壤枯枝落叶库中。FORCCHN2模型计算碳收支的主要过程和计算流程如下:
GPPi=min(fc×fdry×fT×GPPMi,an×aNS) 式中,GPPi为第i棵树的个体总光合(kg C/d);GPPMi为树木的个体最大总光合;fc、fdry、fT、an×aNS分别为CO2浓度、土壤水分条件、气温及土壤有效氮对总光合的影响,其中aNS为土壤有效氮量(kg/m2),an为同化作用碳氮比参数,an=150。
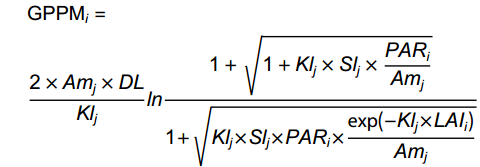
GPPMi=2×Amj×DLKljln1+√1+Klj×Slj×PARiAmj1+√Klj×Slj×PARi×exp(−Klj×LAIi)Amj 式中,DL为当天可照时数;PARi为该树木的个体正午冠顶光合有效辐射;Amj为第j类树木类型的单叶最大可能光合;Klj为第j类树木类型的消光系数,无量纲;Slj为第j类树木类型的光强-光合作用曲线初始斜率;LAIi为该树木的叶面积指数。
单株树木的日维持呼吸由叶、枝、干、根和细根的维持呼吸构成。叶、枝、干呼吸构成地上部分呼吸量,根和细根呼吸构成地下部分呼吸量。它们的日呼吸量(kg/d)表示为:
RMik=tresp×rkCik 式中,i为第i棵树,k为各个器官,tresp表示气温对植物呼吸的影响系数,rk为在气温为15 ℃时,叶、枝、干、根和细根的相对呼吸速率;Cik为相应碳库的库量。
生长呼吸指的是初级光合产物转化为结构干物质时的消耗,在树木碳平衡中起重要作用,在日光合作用大于维持呼吸时才有净积累。本模型采用与总光合-维持呼吸成正比的生长呼吸计算公式,即单株树木的生长呼吸为:
RGi=tresp×rg×(GPPi−RMi) 式中,rg是生长呼吸系数,为一常数,一般取值0.2~0.3,本模型取0.25,即每合成1 g干物质需要1.38 g的葡萄糖。
土壤呼吸(SR)过程逐日模拟,采用改进后的土壤碳收支模型CENTURY[32]进行模拟和预测。
NEP的计算取决于GPP、生长呼吸(RG)、维持呼吸(RM)以及土壤呼吸(SR):
dNEPdt=∑dGPPidt−∑dRMidt−∑dRGidt−∑dSRdt 式中,i是地块中第i棵树,t为时间(d)。
其他详细模型计算方程参考Fang等[17]的研究。
1.4 分析方法
1.4.1 变化趋势分析
结合Sen斜率估计法(Theil-Sen)趋势分析和趋势检验法(Mann-Kendall检验)分析NEP增减的空间格局。采用Theil-Sen中值趋势分析方法和Mann-Kendall检验来解释NEP的年际变化趋势。Sen斜率估计是一种非参数统计的趋势计算方法,适用于长时间序列数据的趋势分析。Mann-Kendall检验是一种非参数的时间序列趋势性检验方法,不需要测量值服从正态分布,不受缺失值和异常值的影响,适用于长时间序列数据的趋势显著检验。两种方法相结合已成为确定长期时间序列数据趋势的重要手段[33, 34]。
1.4.2 相关分析
采用相关分析方法研究植被与气候因子的关系。计算2002-2020年水源地NEP与对应年份日均总辐射、年降水量和年平均气温的相关系数,并进行显著性检验,反映不同气候因子与NEP的相关程度[35, 36]。
1.4.3 模型验证
为评估模型对森林生态系统碳通量的模拟性能,本文分别采用模拟结果与观测站点观测值的相关系数(R)和均方根误差(RMSE)来进行分析。
2. 结果与分析
2.1 FORCCHN2模型验证
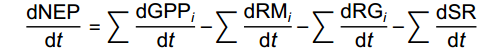
将本研究中FORCCHN2模型的预测结果与秦岭生态站2010-2013年的通量数据进行对比(图2),结果显示,GPP、ER(生态系统呼吸,SR+VR)、NEP的模拟值与实测值均显著相关(P<0.001),说明FORCCHN2模型对水源地NEP、GPP、ER具有良好的模拟能力。
![]() 图 2 总初级生产力(A)、生态系统呼吸(B)、净生态系统生产力(C)模拟值与观测值比较GPP:总初级生产力;ER:生态系统呼吸;NEP:净生态系统生产力;OB:观测值;SIM:模拟值。Figure 2. Comparison between simulated and observed values of gross primary productivity (A), ecosystem respiration (B), and net ecosystem productivity (C)GPP: Gross primary productivity; ER: Ecosystem respiration; NEP: Net ecosystem productivity; OB: Observed value; SIM: Simulated value.
图 2 总初级生产力(A)、生态系统呼吸(B)、净生态系统生产力(C)模拟值与观测值比较GPP:总初级生产力;ER:生态系统呼吸;NEP:净生态系统生产力;OB:观测值;SIM:模拟值。Figure 2. Comparison between simulated and observed values of gross primary productivity (A), ecosystem respiration (B), and net ecosystem productivity (C)GPP: Gross primary productivity; ER: Ecosystem respiration; NEP: Net ecosystem productivity; OB: Observed value; SIM: Simulated value.2.2 时空变化特征
2.2.1 NEP、GPP、SR、VR年际变化特征
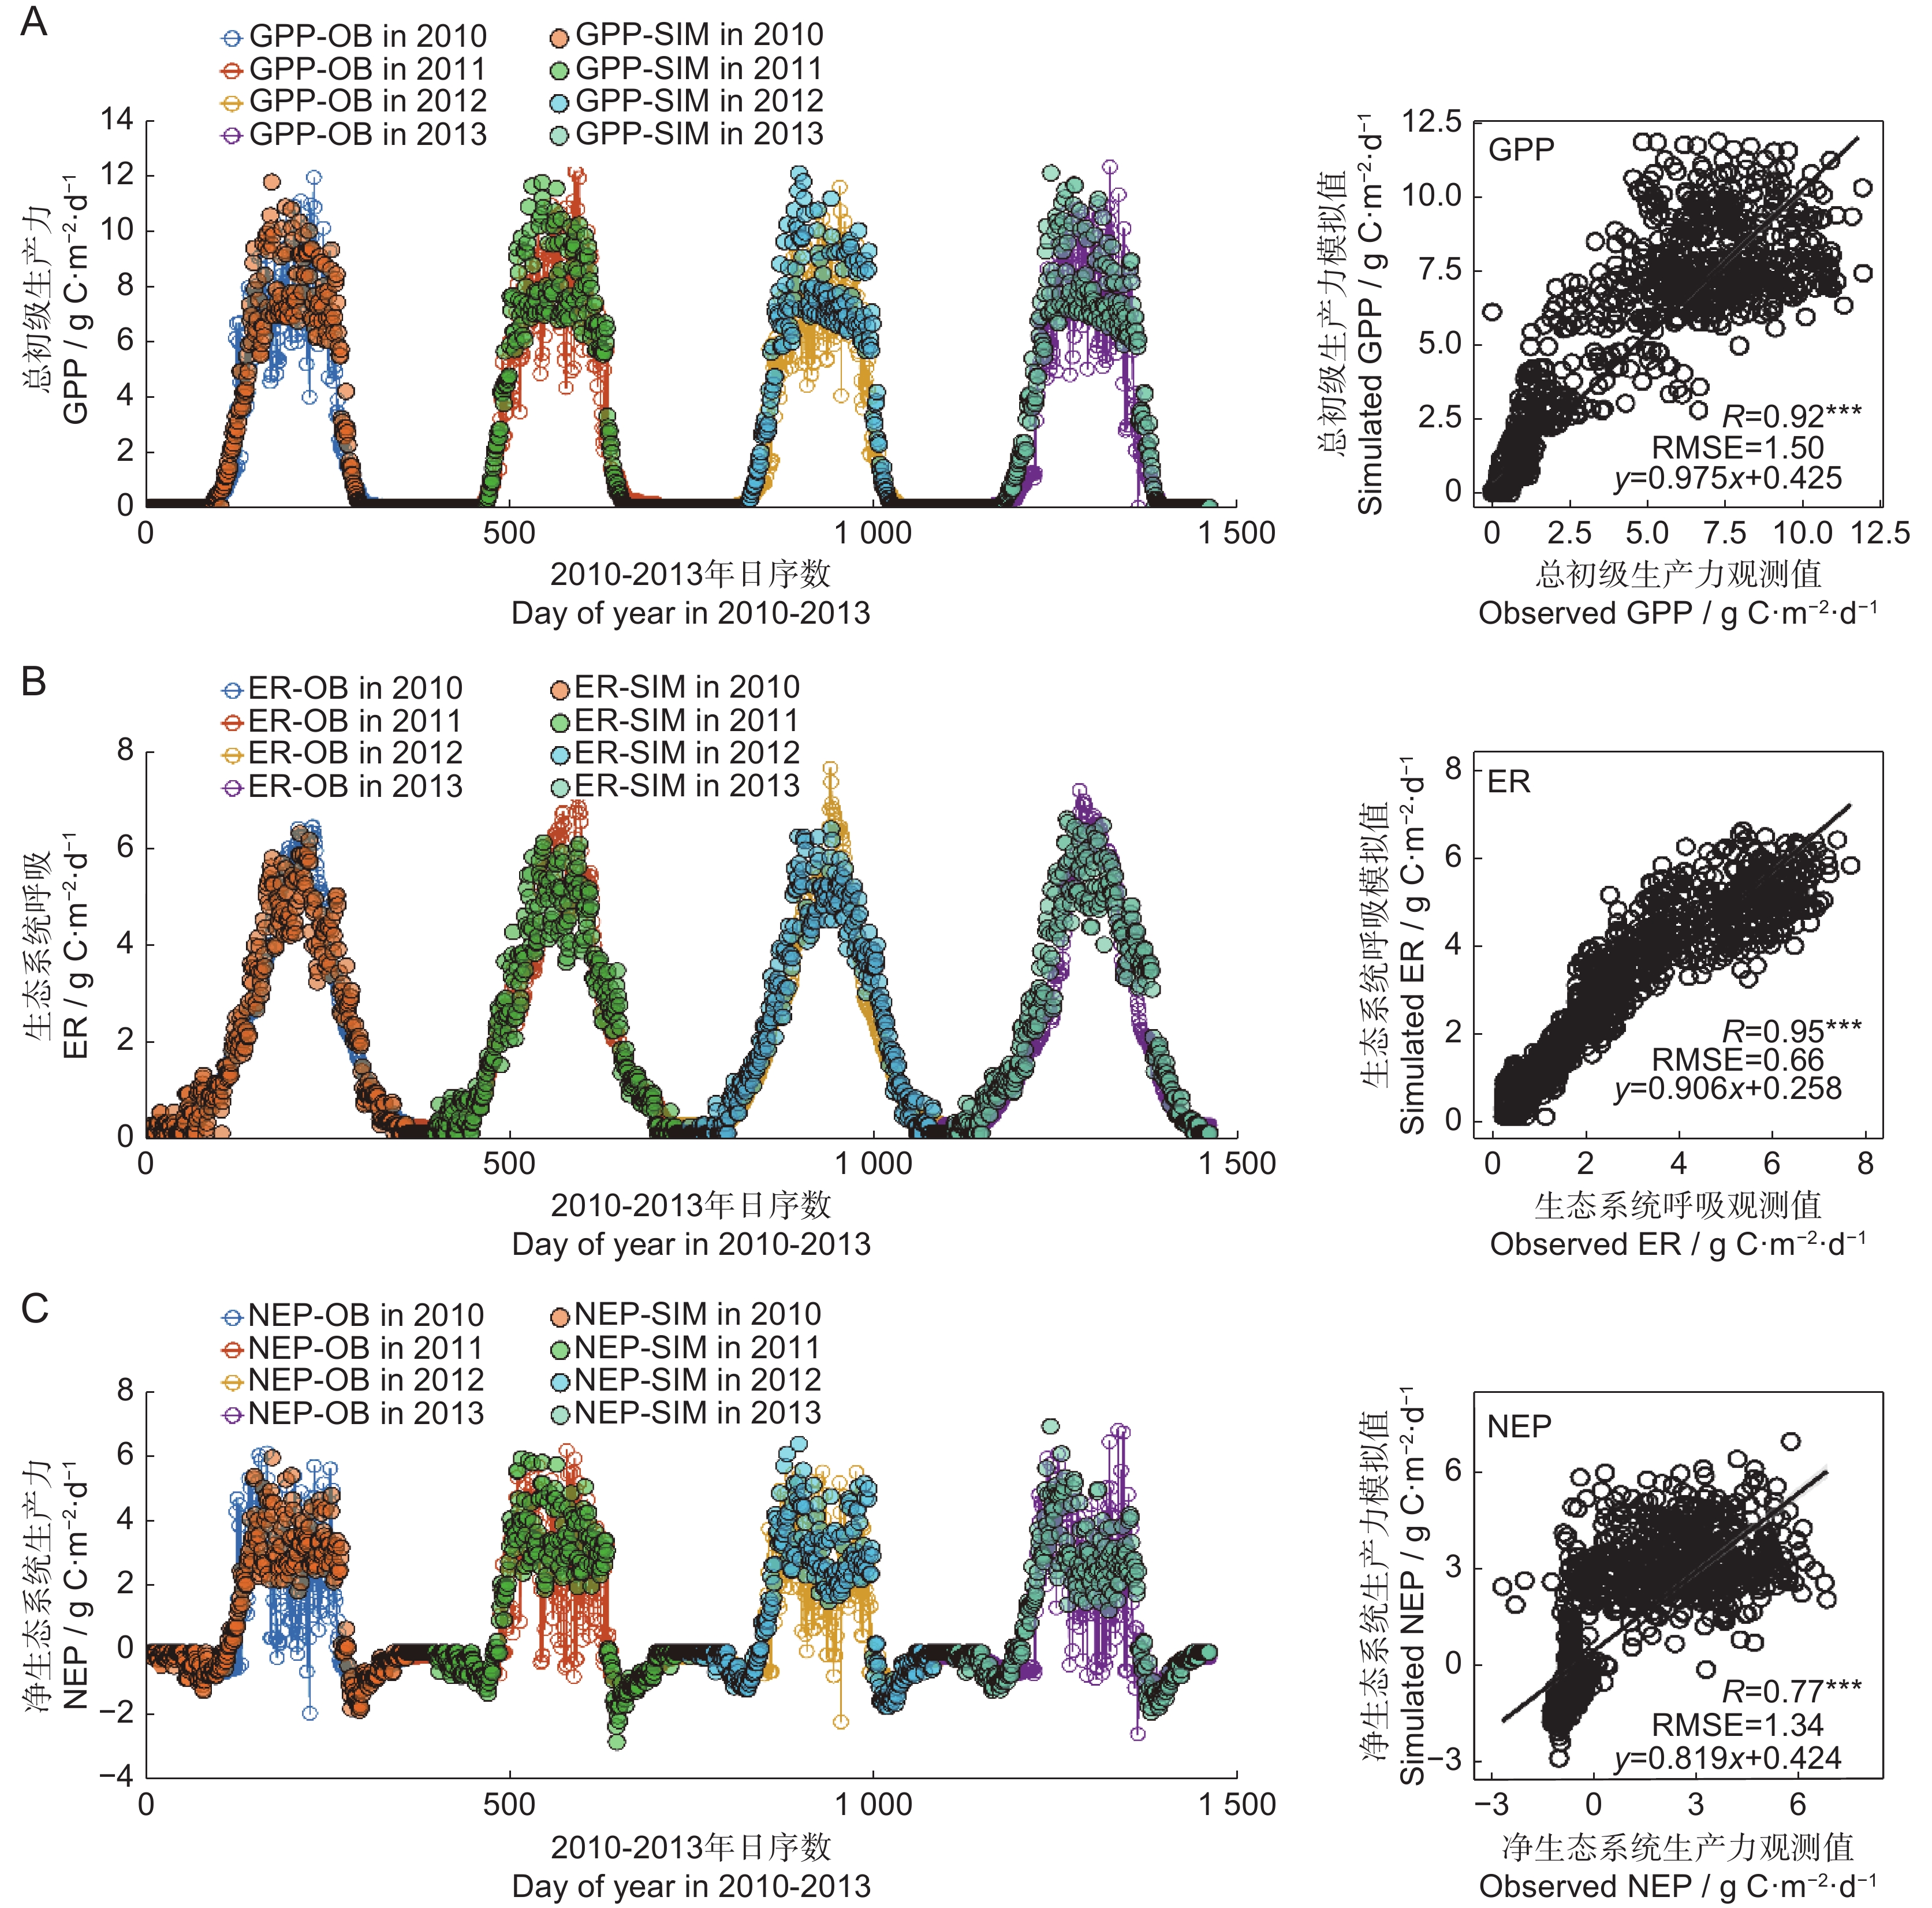
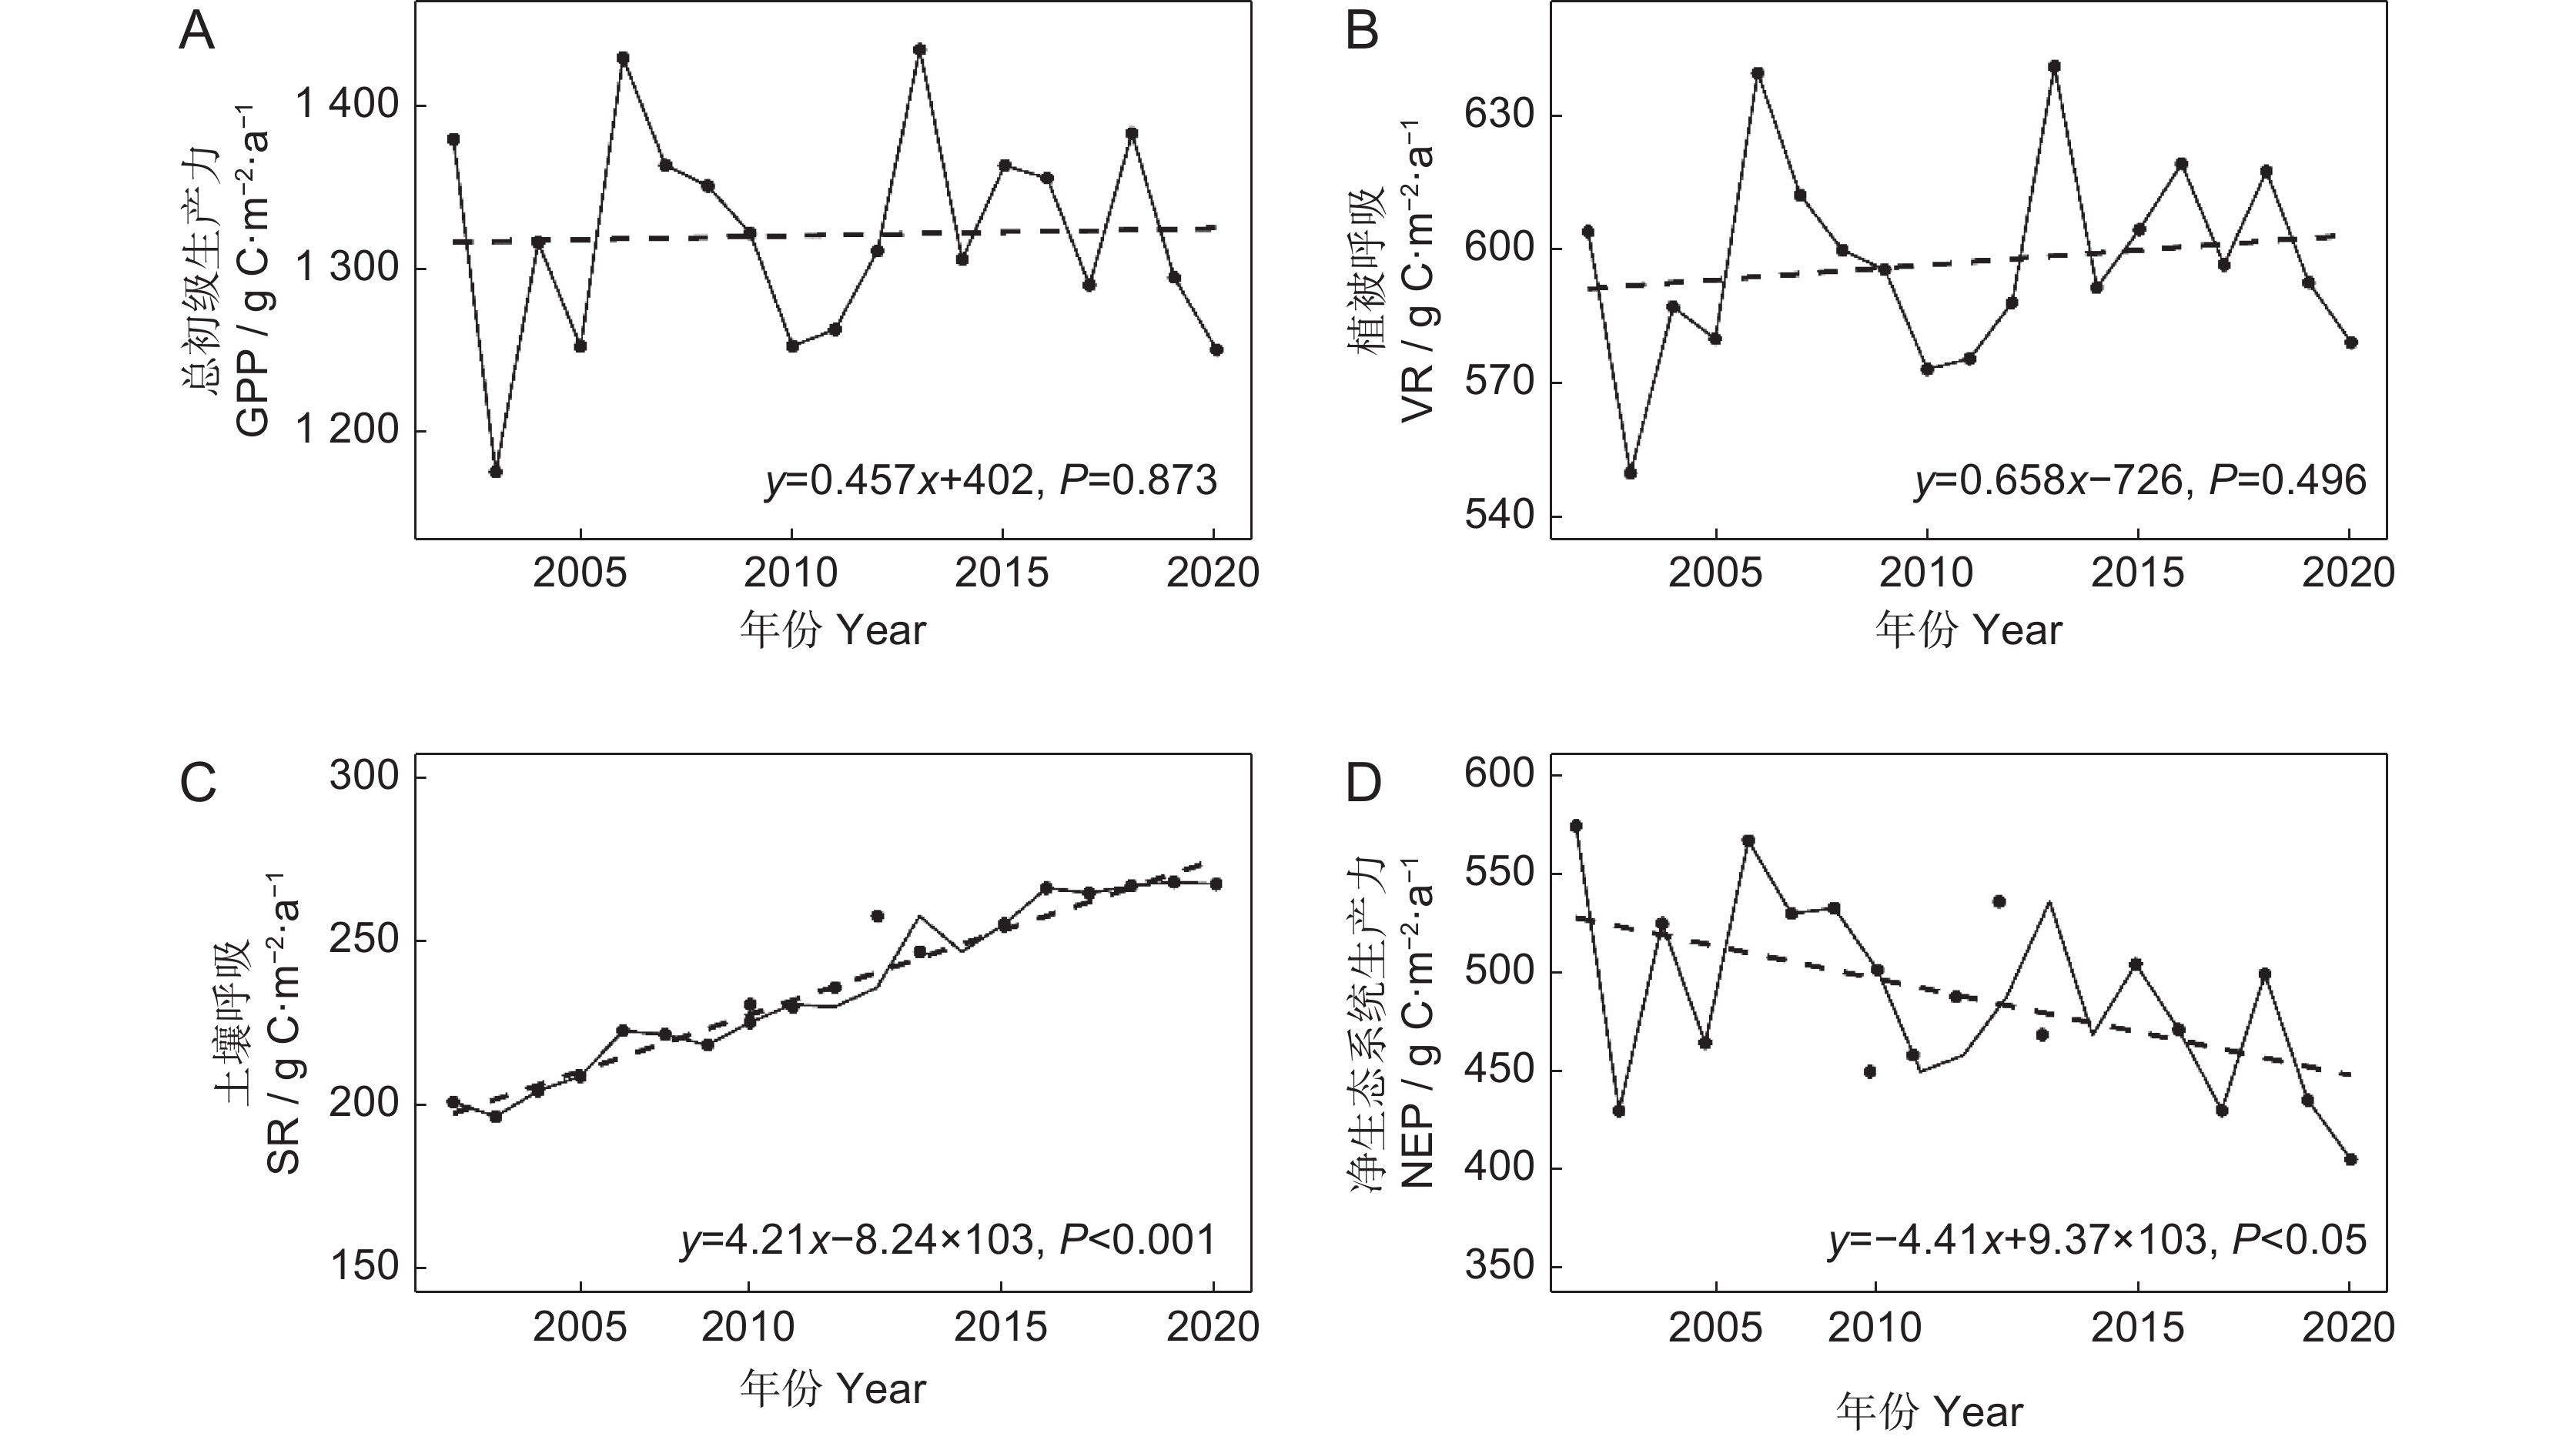
如图3所示,水源地GPP年均值为1 320.75 g/m2,最低值和最高值分别为2003年的1 177.51和2013年的1 432.98 g/m2。VR年均值为596.94 g/m2,2003年最低,2013年最高。2002-2020年,水源地SR增加趋势显著(P<0.001),增速为4.21 g·m−2·a−1,年均值为235.13 g/m2,2003年最低,2019年最高,分别为196.25、266.29 g/m2。水源地NEP年际变化主要由GPP与ER决定,由于研究期间ER增加的速率大于GPP,导致NEP呈下降趋势(P<0.05),下降速度约为8.85 g·m−2·a−1,年平均值为488.68 g/m2,总的来说,水源地NEP大于0,仍为碳汇功能区域。
![]() 图 3 2002-2020年水源地GPP(A)、植被呼吸(B)、土壤呼吸(C)、NEP(D)年际变化特征Figure 3. Interannual variation characteristics of GPP (A), vegetation respiration (B), soil respiration (C), and NEP (D) in the water source area from 2002 to 2020
图 3 2002-2020年水源地GPP(A)、植被呼吸(B)、土壤呼吸(C)、NEP(D)年际变化特征Figure 3. Interannual variation characteristics of GPP (A), vegetation respiration (B), soil respiration (C), and NEP (D) in the water source area from 2002 to 20202.2.2 NEP空间变化特征
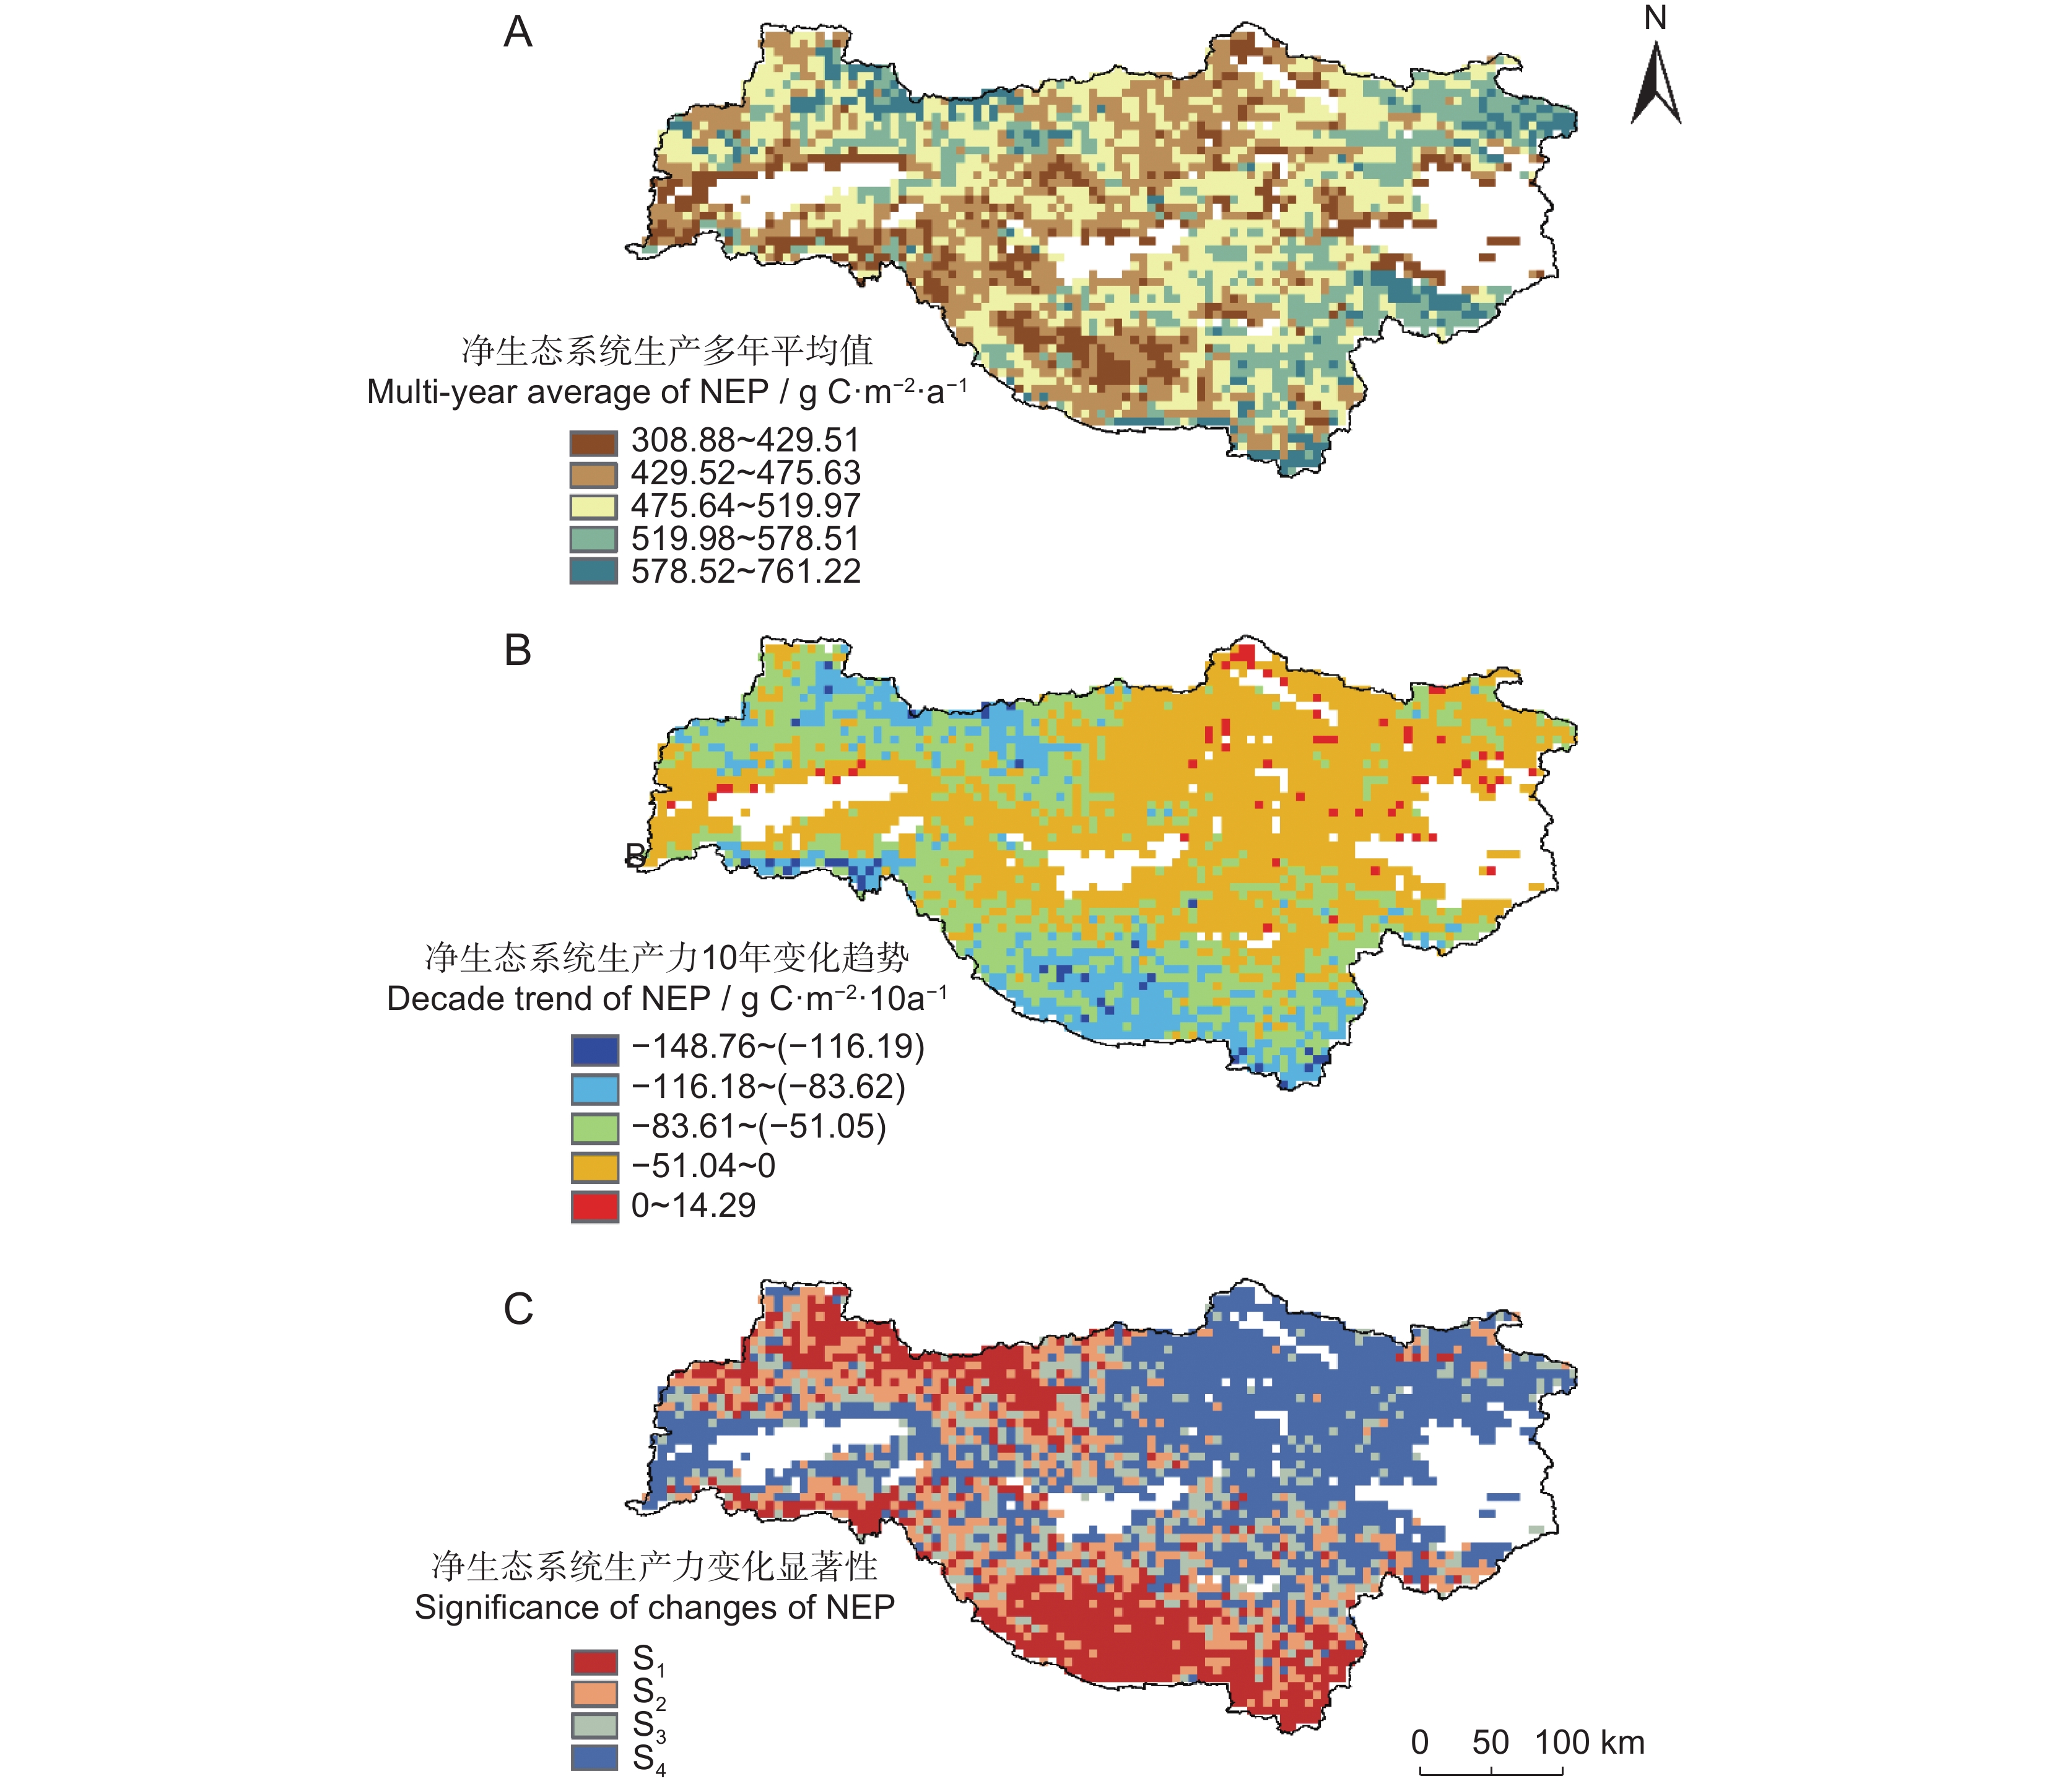
总体来说,水源地西北部的秦岭山脉地区、西南部的大巴山脉地区为成熟林区域(林龄60年以上),森林NEP显著降低,水源地区域东部的丹江口水库周边地区为低龄林区域(林龄60年以下,图1:C),森林NEP无显著变化(图4)。水源地森林NEP在2002-2020年像元尺度上的平均值为308.88~761.22 g/m2,10年变化趋势为−148.76~14.09 g/m2。
![]() 图 4 2002-2020年水源地NEP平均值(A)、10年变化趋势(B)和变化显著性(C)空间分布特征S1:极显著减少;S2:显著减少;S3:微减少;S4:无显著变化。Figure 4. Spatial distribution characteristics of multi-year average of NEP (A), decade trend of NEP (B), and significance of changes in NEP (C) in the water source area from 2002 to 2020S1: Extremely significant reduction; S2: Significant reduction; S3: Slight decrease; S4: Not significant.
图 4 2002-2020年水源地NEP平均值(A)、10年变化趋势(B)和变化显著性(C)空间分布特征S1:极显著减少;S2:显著减少;S3:微减少;S4:无显著变化。Figure 4. Spatial distribution characteristics of multi-year average of NEP (A), decade trend of NEP (B), and significance of changes in NEP (C) in the water source area from 2002 to 2020S1: Extremely significant reduction; S2: Significant reduction; S3: Slight decrease; S4: Not significant.2.3 水源地森林NEP变化的影响因素分析
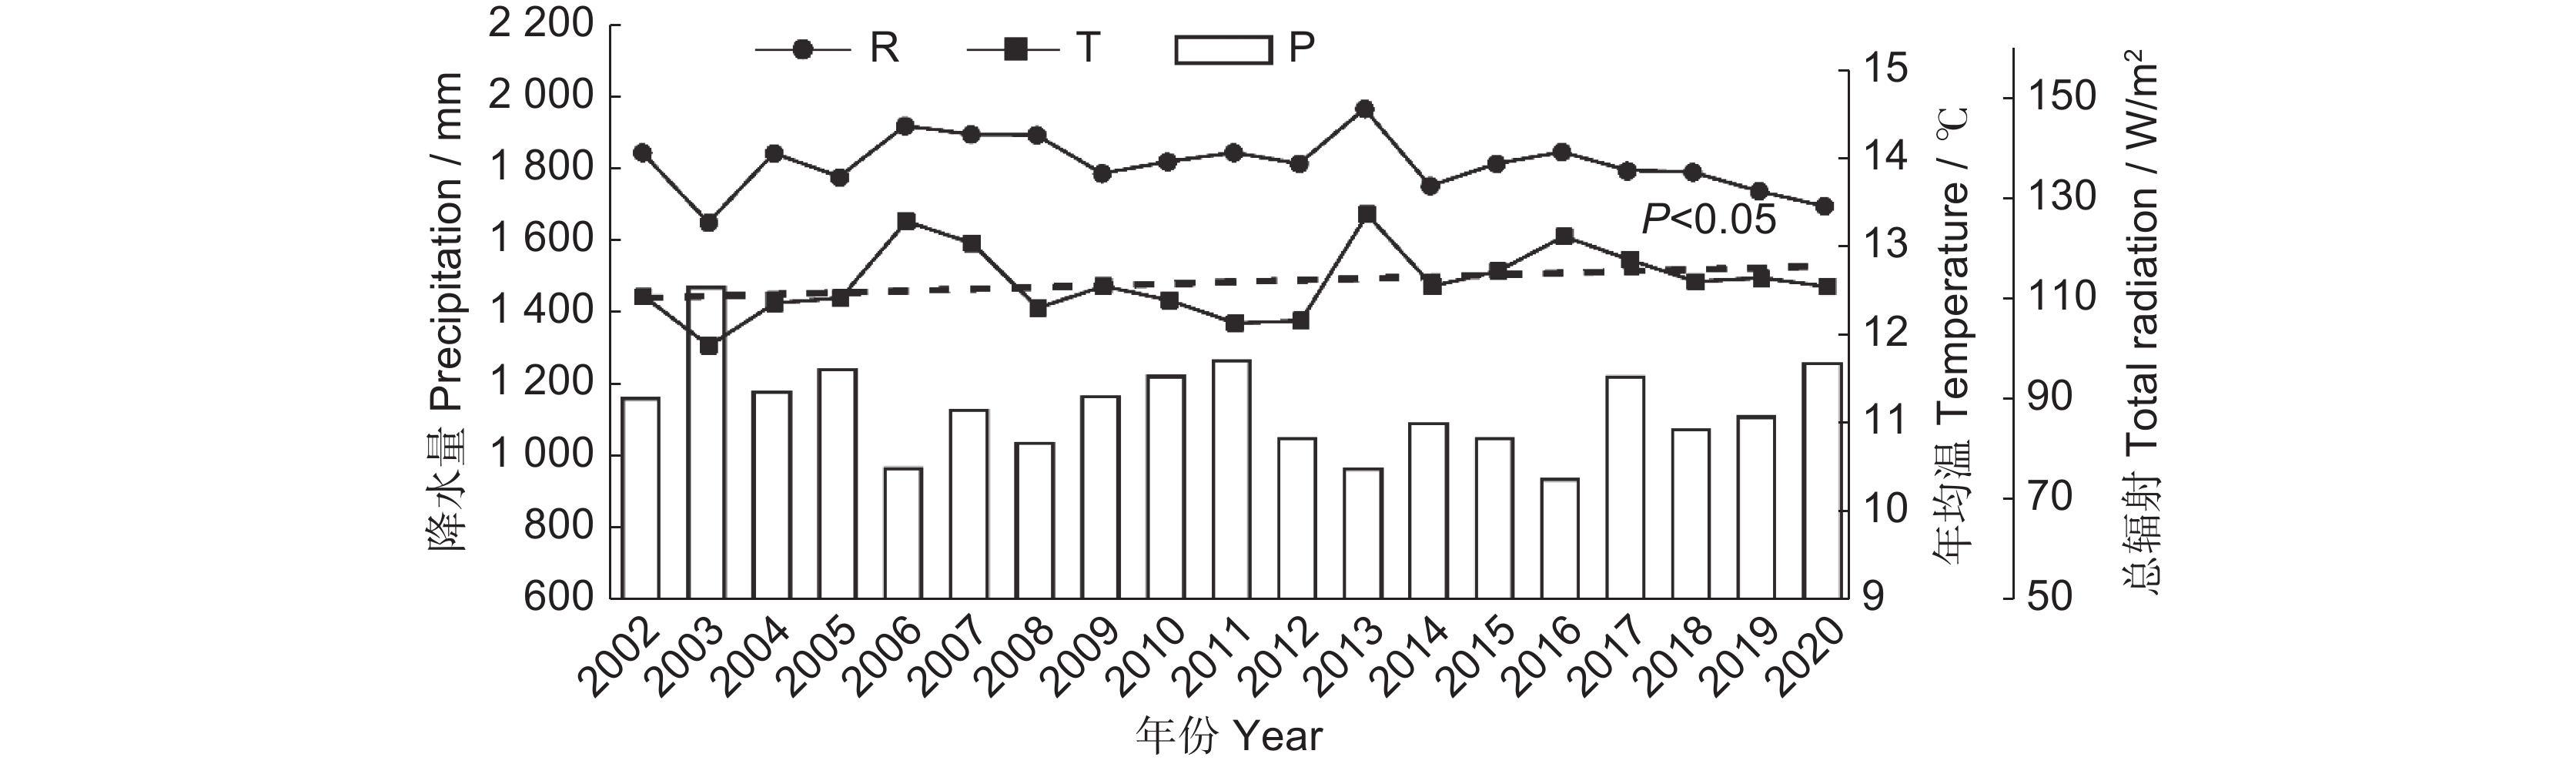
气象因子的年际变化特征如图5所示。总体上,2002-2020年平均气温在11.93 ℃~13.44 ℃,2003年最低,2013年最高,年际变化呈显著上升趋势(P<0.05),上升率为0.062 ℃/10 a。年降水量为939.08~1 481.42 mm,最低值出现在2016年,最高值为2003年,年际变化不显著。日均总辐射为122.85~145.78 W/m2,最低值在2003年,最高值在2013年,年际变化不显著。
![]() 图 5 2002-2020年水源地气候要素年际变化趋势P:年总降水;T:年均温;R:日均总辐射。Figure 5. Interannual variation trends in climate elements in the water source area from 2002 to 2020P: Annual total precipitation; T: Mean annual temperature; R: Daily total radiation. Same below.
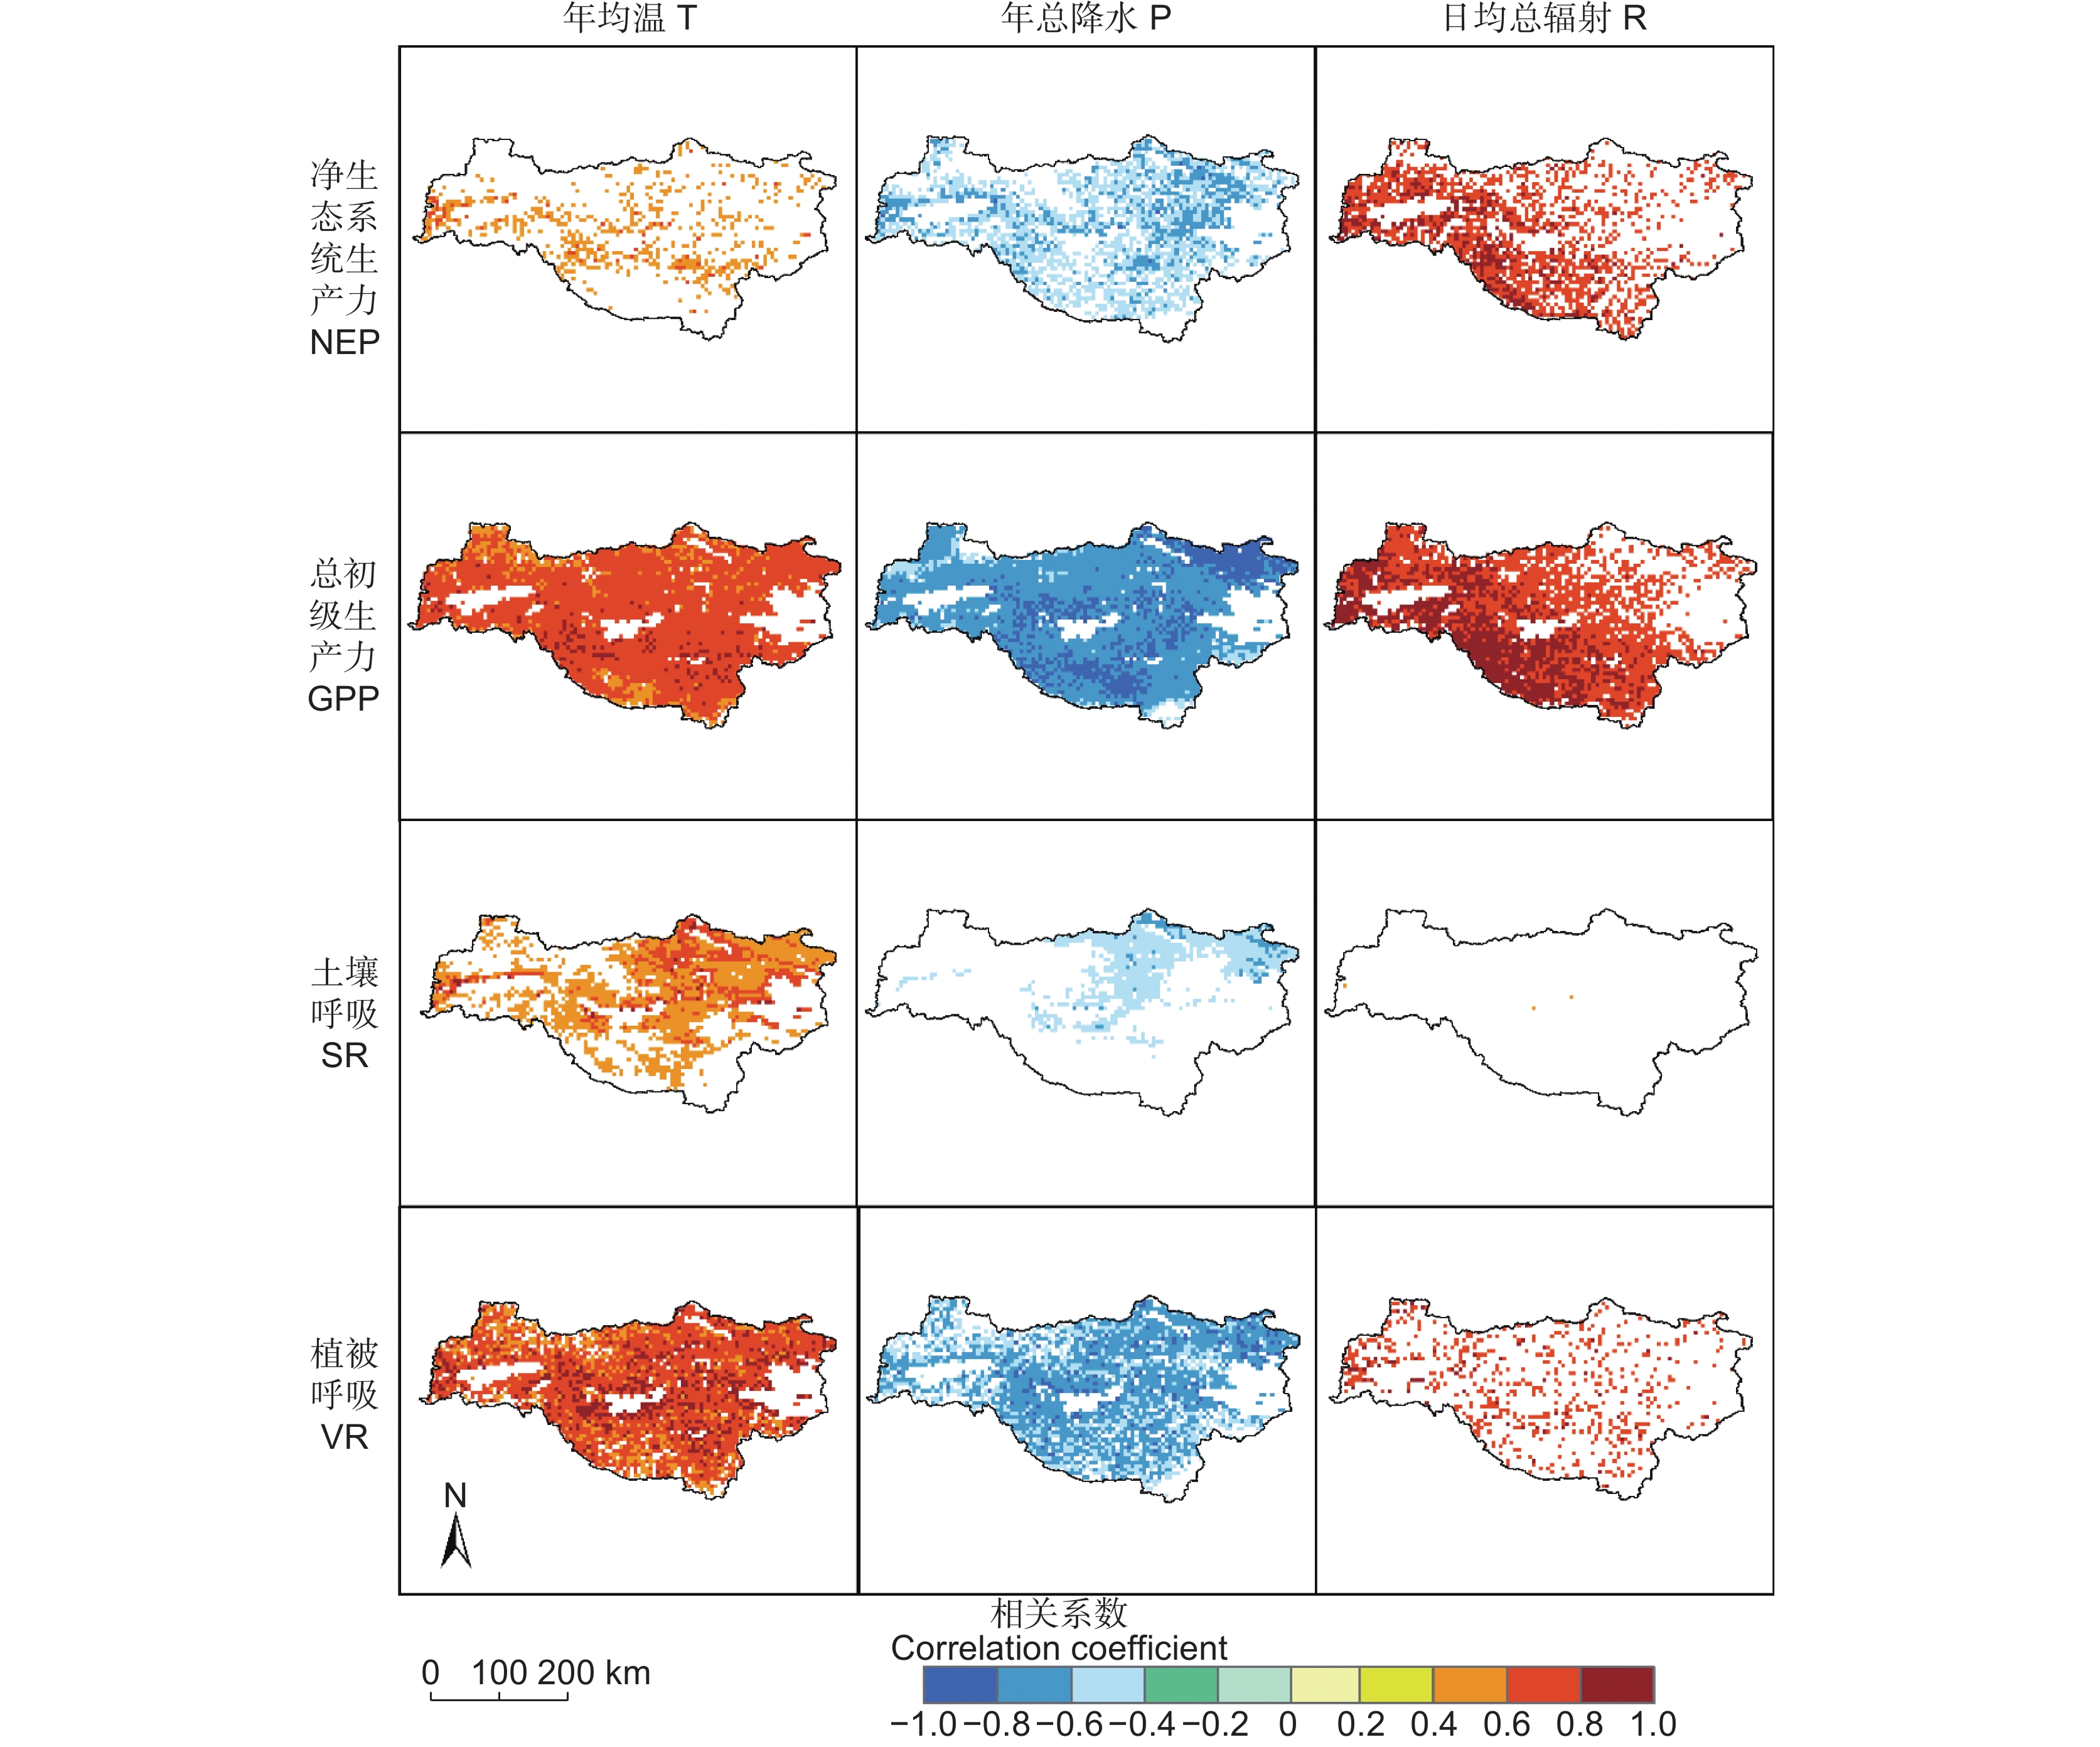
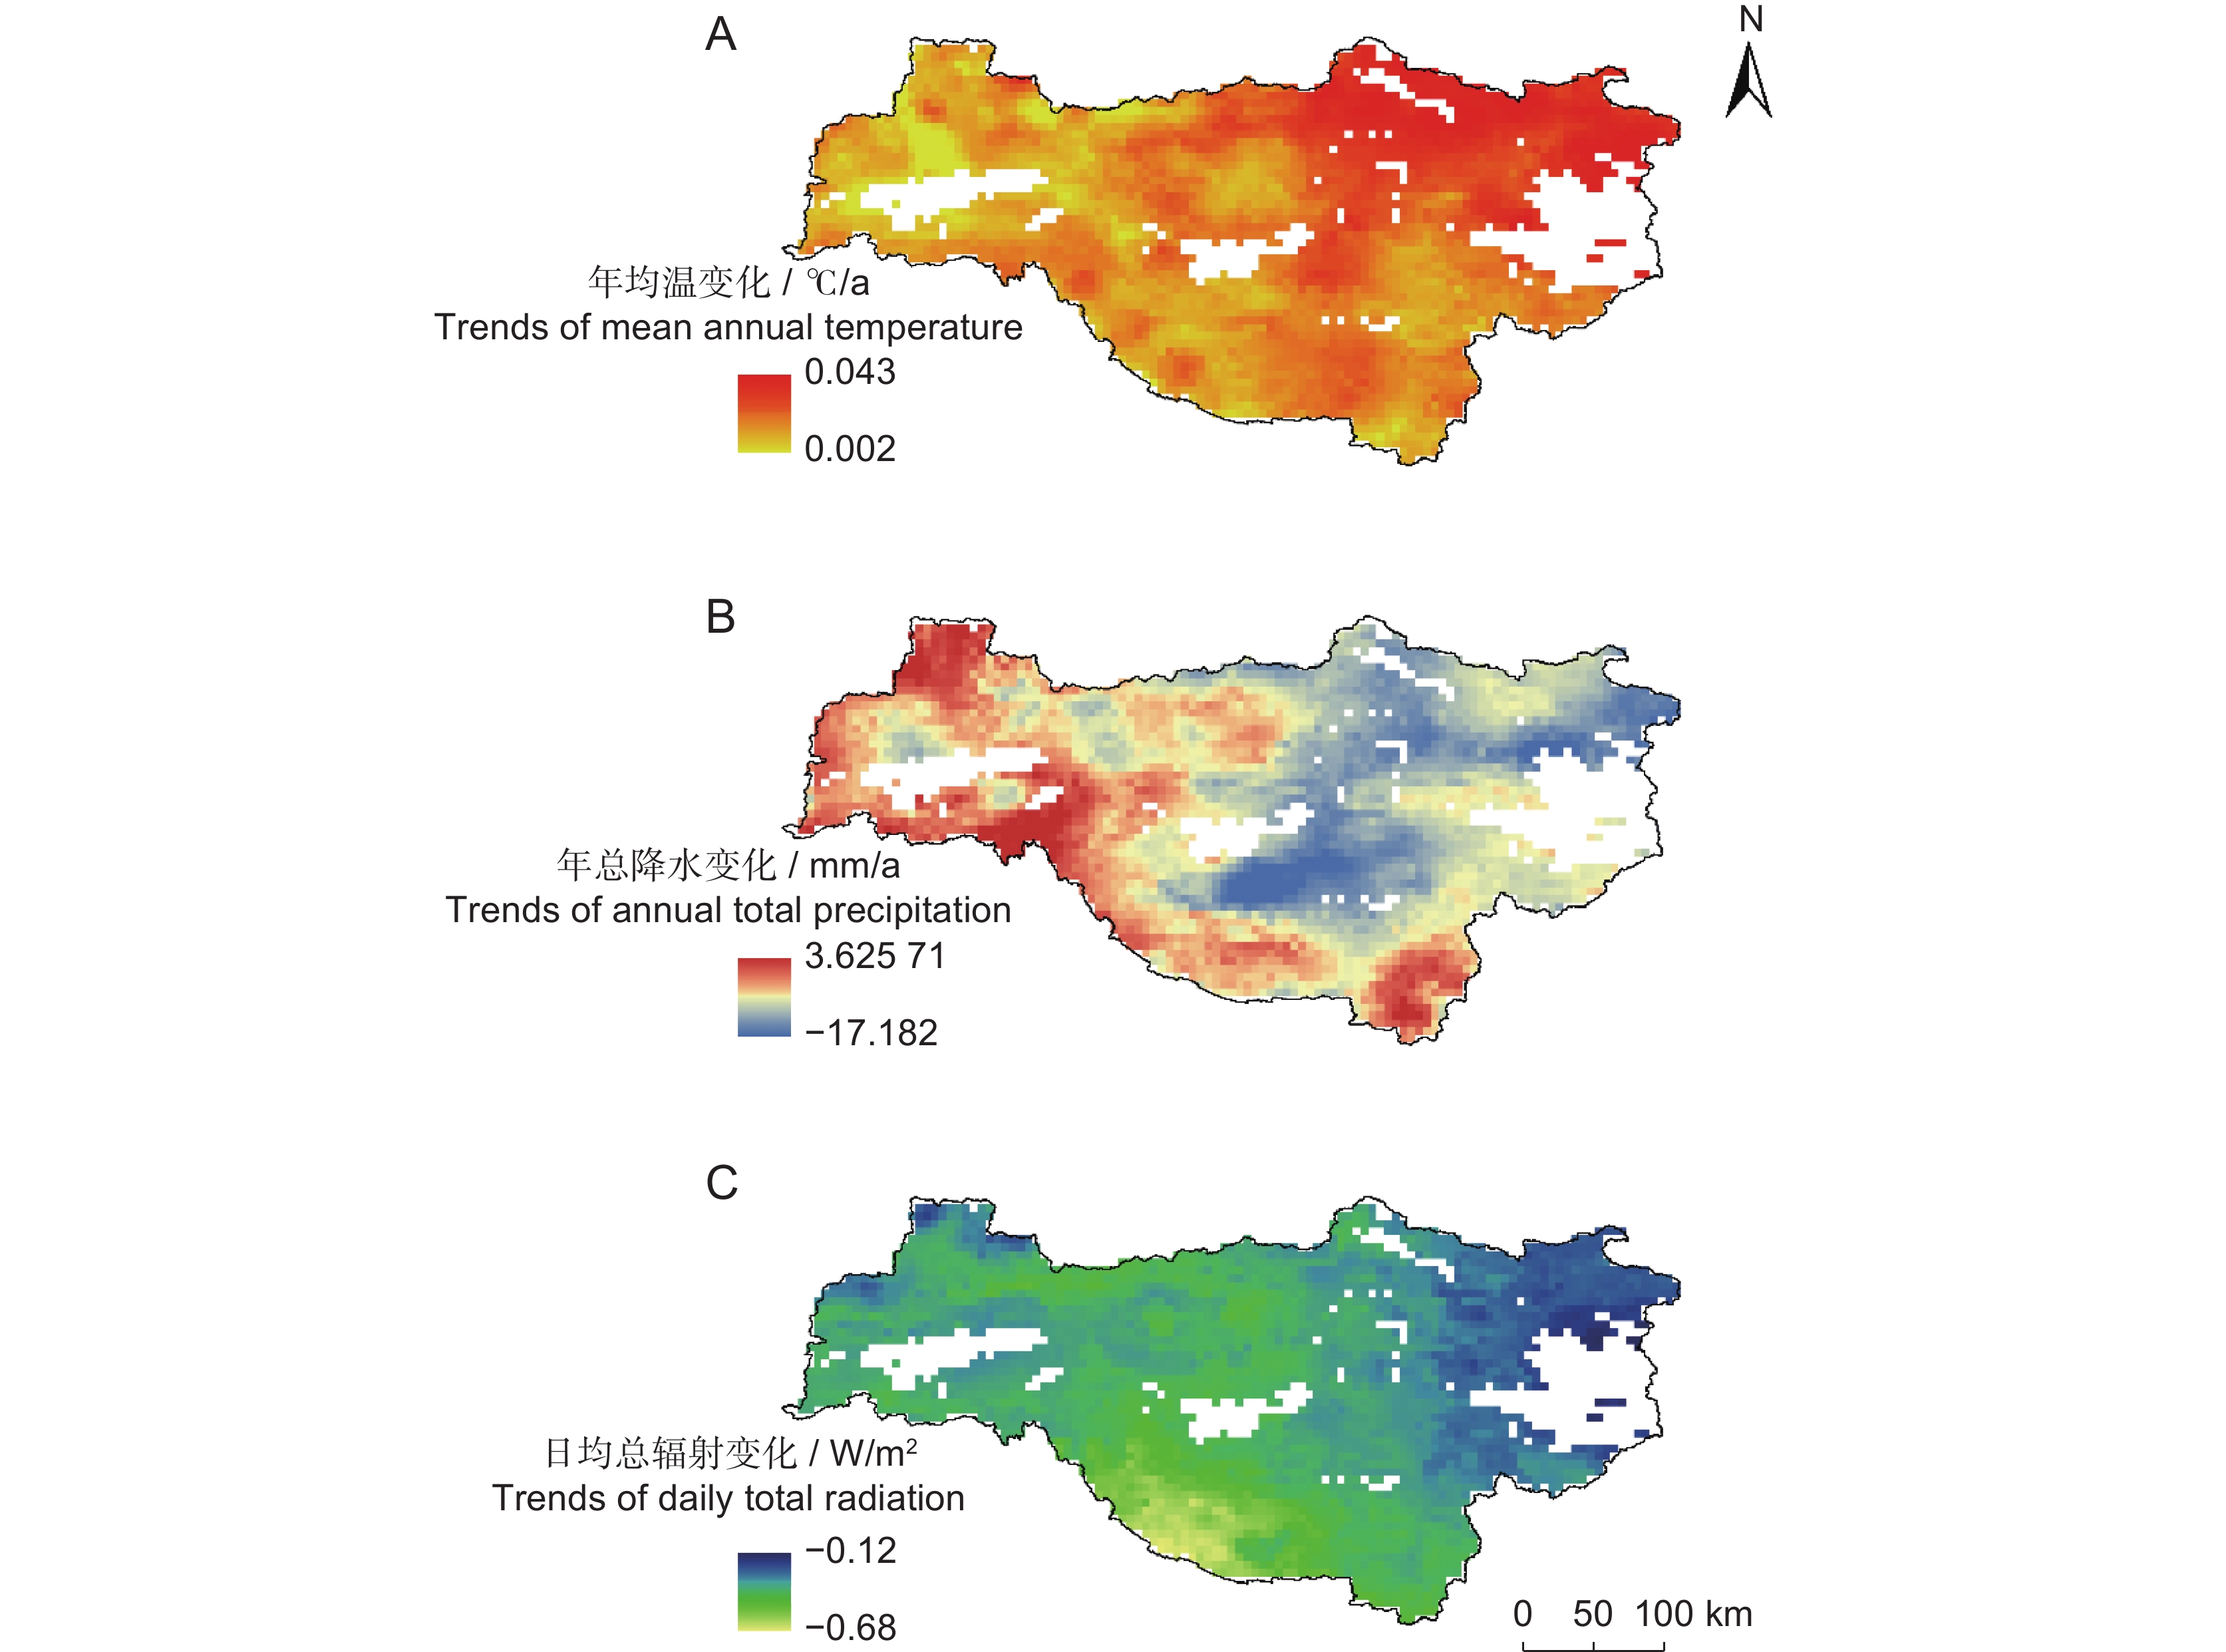
图 5 2002-2020年水源地气候要素年际变化趋势P:年总降水;T:年均温;R:日均总辐射。Figure 5. Interannual variation trends in climate elements in the water source area from 2002 to 2020P: Annual total precipitation; T: Mean annual temperature; R: Daily total radiation. Same below.本研究对水源地NEP与气候要素进行了像元尺度相关分析,并进行了显著性检验,结果如图6所示。分析表明,日均总辐射和年均温分别与水源地98.41%(主要位于西部与西南部)和19.55%区域的NEP呈显著正相关,而年降水与61.57%区域的NEP呈显著负相关。GPP与日均总辐射和年均温呈显著正相关,通过显著性检验(95%)的区域分别占99.71%和98.38%,与日均总辐射相关系数较高的区域位于西南部与西北部地区,而GPP与年降水在97.20%的区域呈显著负相关。SR与57.53%区域的年均温呈显著正相关(主要位于东部),与26.16%区域的年降水呈显著负相关。日均总辐射和年均温分别与83.53%和92.37%区域的VR呈显著正相关,而年降水与83.18%区域的VR呈显著负相关。同时,对气候要素进行年空间变化Theil-Sen趋势分析(图7)。结果表明,年均温的空间变化格局为水源地东部升高速率比西部快;年总降水变化为中部地区、东北部地区呈下降趋势,而南部与西部地区为增加趋势;日均总辐射的变化格局为东部下降速率大于西北部与西南部。
![]() 图 6 水源地不同指标相关系数的空间分布结果已通过95%显著性检验,NEP、GPP、VR与日均总辐射(R)相关分析图通过99.9%的显著性检验。Figure 6. Spatial distribution of correlation coefficients of different indicators in the water source areaResults have passed the 95% significance test. Correlation analysis figures of NEP, GPP, and VR with daily total radiation R have passed the 99.9% significance test.
图 6 水源地不同指标相关系数的空间分布结果已通过95%显著性检验,NEP、GPP、VR与日均总辐射(R)相关分析图通过99.9%的显著性检验。Figure 6. Spatial distribution of correlation coefficients of different indicators in the water source areaResults have passed the 95% significance test. Correlation analysis figures of NEP, GPP, and VR with daily total radiation R have passed the 99.9% significance test.![]() 图 7 水源地年均温(A)、年总降水(B)和日均总辐射(C)的空间变化趋势Figure 7. Trends of mean annual temperature (A), annual total precipitation (B), and daily total radiation (C) in the water source area
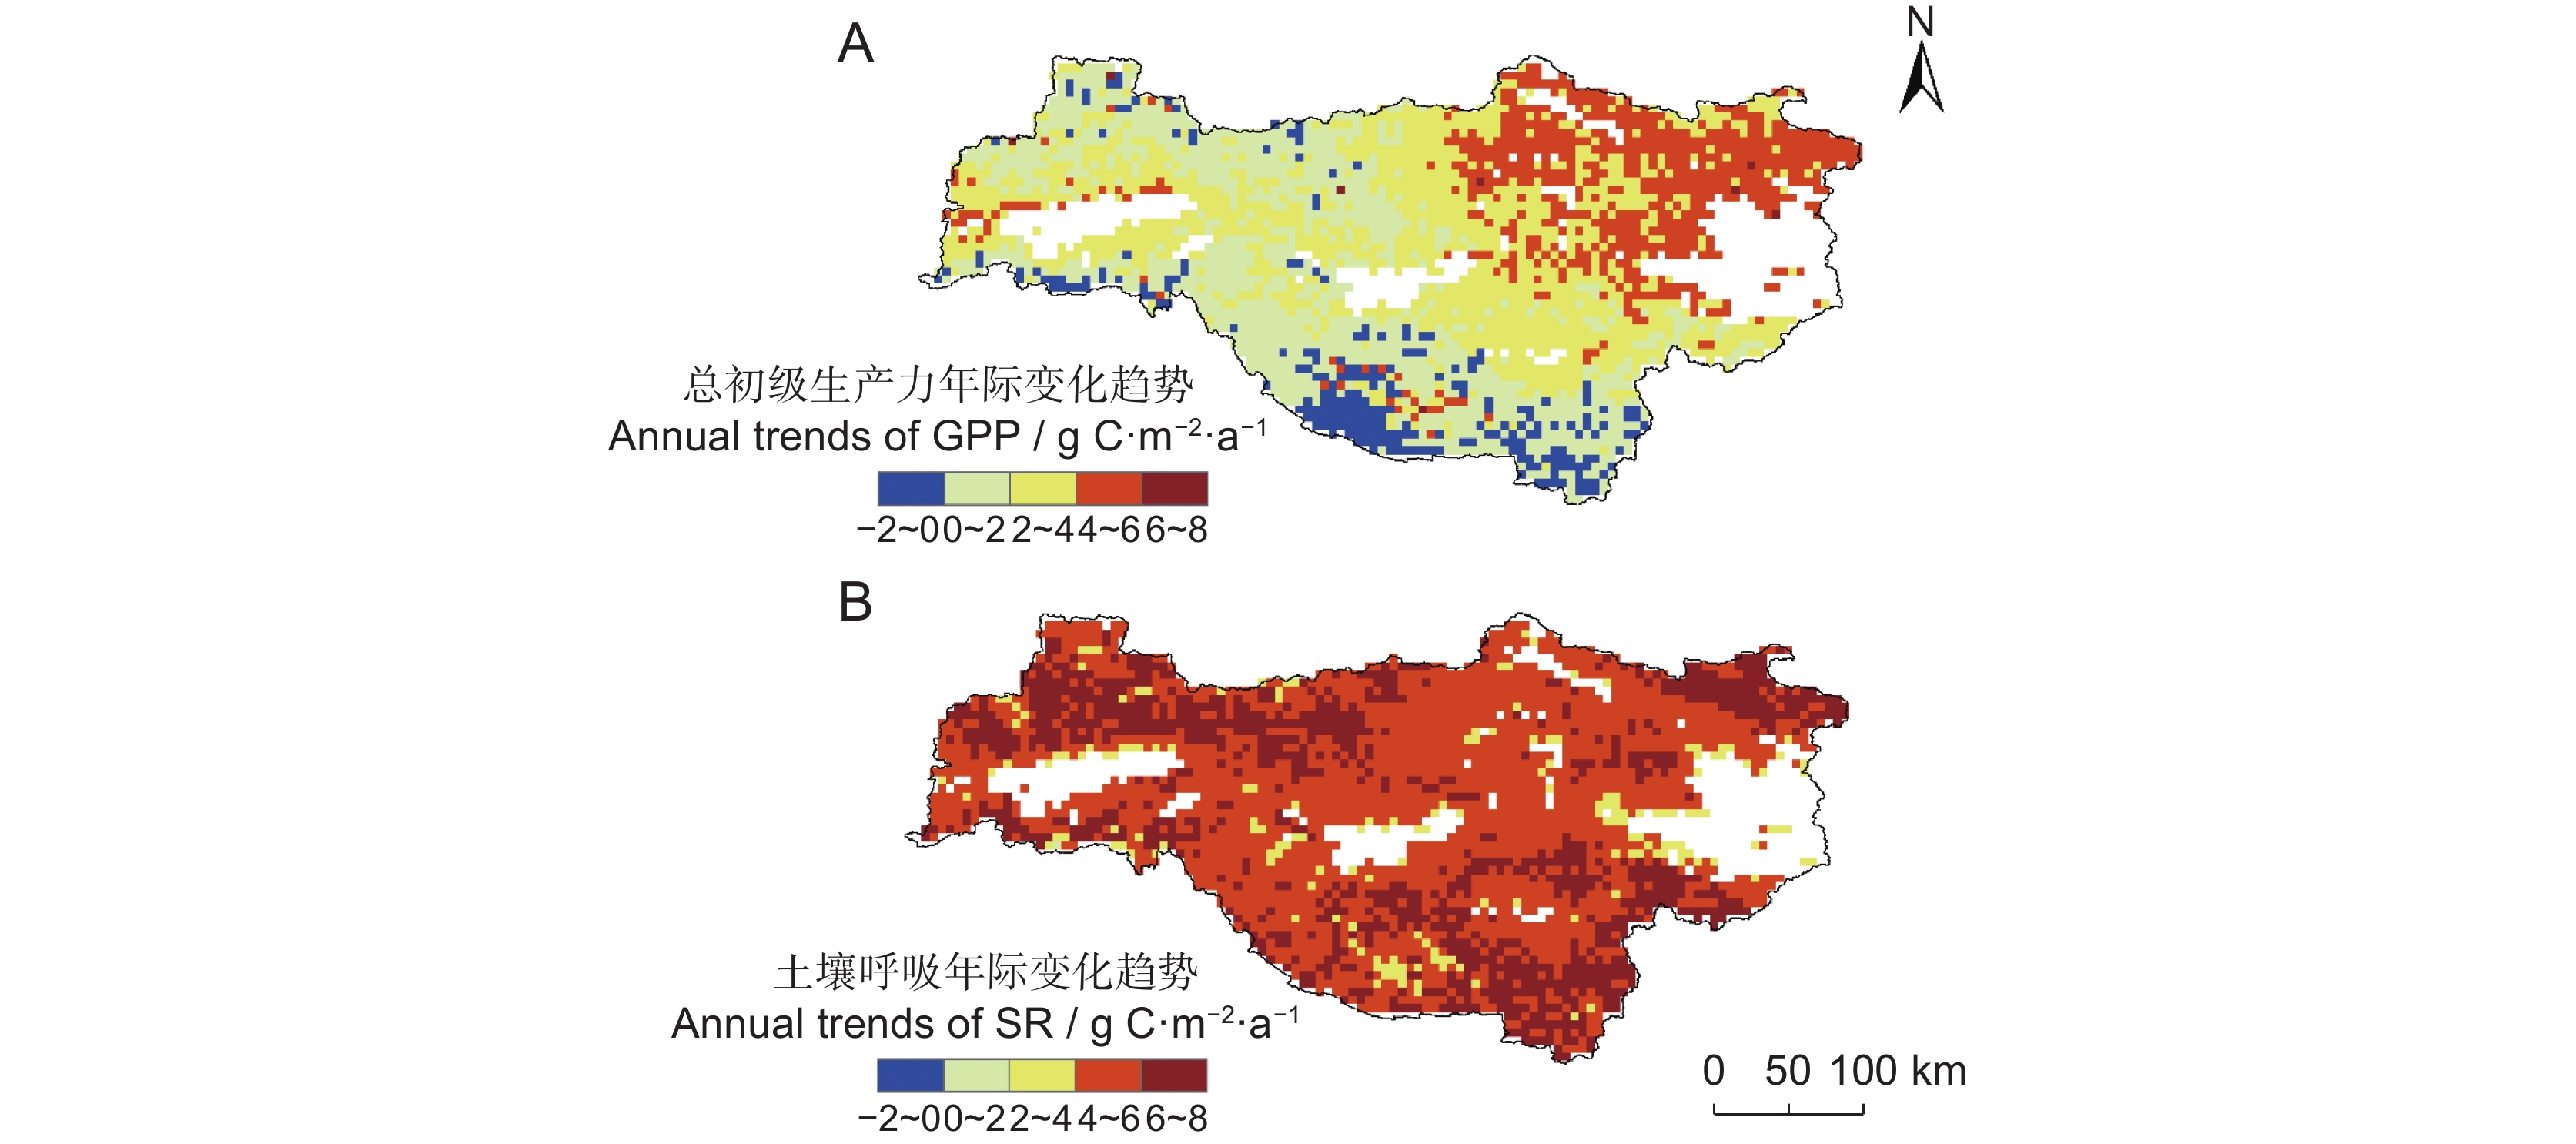
图 7 水源地年均温(A)、年总降水(B)和日均总辐射(C)的空间变化趋势Figure 7. Trends of mean annual temperature (A), annual total precipitation (B), and daily total radiation (C) in the water source area本研究分析了2002-2020年SR及GPP年际变化趋势的空间格局(图8)。结果显示,水源地东部丹江口水库周边区域的SR增加速度高于GPP;西北与西南部秦岭、大巴山脉区域的GPP呈下降趋势。
![]() 图 8 水源地GPP(A)和SR(B)的年际变化趋势Figure 8. Annual trends of GPP (A) and SR (B) in the water source area from 2002 to 2020
图 8 水源地GPP(A)和SR(B)的年际变化趋势Figure 8. Annual trends of GPP (A) and SR (B) in the water source area from 2002 to 20203. 讨论
FORCCHN2模型在全球以及北美森林已被广泛使用[18-20, 35],本研究利用该模型模拟了水源地森林NEP的变化,将模拟数据与野外生态站观测数据对比发现,二者结果较为一致,表明该模型的模拟结果可靠。
本研究发现,2002-2020年间,水源地森林的碳汇能力呈下降趋势,且具有空间异质性。水源地NEP整体呈显著下降趋势,可能是土壤呼吸增加所导致的。由于水源地处于我国退耕还林政策先行试验区,丹江口水库周边区域的植被在研究期间处于幼龄林到中龄林状态,土壤裸露面积较大,水分散失较快,土壤呼吸较高,从而导致生态系统的碳汇能力降低[37]。相关分析表明,土壤呼吸与温度相关显著区域位于丹江口水库周边区域,与该结果一致。因此,在全球气候变暖背景下,森林树木生长与气候变化使得土壤呼吸的增长比GPP快,但随着树木的生长,土壤呼吸增长减慢,GPP的增加快于生态系统的呼吸作用,水源地的碳汇能力也会逐渐增加。
此外,水源地NEP的分布及其受气候因子的影响,具有空间差异性。研究结果发现,秦岭和大巴山脉森林的NEP下降比丹江口水库周边区域更为明显,这可能与海拔有一定关系[38]。不同海拔的水热环境、太阳能量通量、CO2浓度等均不同,这些都会对植被NEP产生影响。逐像元相关分析结果表明,日均总辐射和年均温分别与水源地98.41%和19.55%区域的NEP呈显著正相关,而年降水与61.57%区域的NEP呈显著负相关,这说明NEP受太阳辐射的影响最大,其次是降水和温度。这与Wang等[39]对中国森林生态系统的研究结果一致。研究表明,自1999年开始,随着中国退耕还林工程的实施,受降水影响的植被比例逐渐增加,而受气温影响的植被比例下降[40, 41]。研究发现,与丹江口水库周边区相比,秦岭、大巴山区域的太阳总辐射下降速率较快,且GPP在该区域与太阳辐射呈显著正相关,最终导致NEP的下降更明显。前人研究认为,秦岭和大巴山及其毗邻地区的太阳辐射量在年际间呈明显下降趋势,可能是云量和气溶胶的增加所导致[42, 43]。综上所述,水源地NEP受水、光、热条件的共同影响,且气候变化对西北与西南部区域固碳能力的负面影响大于东部丹江口水库的周边区域。
尽管气候变化在水源地森林生态系统的NEP变化中起重要作用,但森林生态系统固碳受到多种因素的综合影响。如,土地利用变化可能导致森林覆盖的变化,进而影响GPP、ER[44],最终影响NEP的变化特征。未来可进一步提高模型模拟的精度,并加强NEP的多元影响因素分析,如CO2施肥效应、土地利用变化和人为活动影响等。
4. 结论
2002-2020年间,水源地森林NEP的多年平均值为308.88~761.22 g/m2,固碳能力呈下降趋势,且秦岭和大巴山脉森林的NEP下降快于丹江口水库周边区域。此外,水源地NEP分别与日均总辐射和年均温呈显著正相关,而与年降水呈显著负相关;GPP、SR、VR均与温度及辐射呈显著正相关,与降水呈显著负相关。气候变化对水源地西北、西南地区森林固碳能力的负面影响大于东部。
-
![]()
图 1 研究区域高程(A)、土地覆盖类型(B)与树龄(C)
非森林区域被掩膜为白色。底图审图号为GS(2020)4619,下同。
Figure 1. Elevation (A), land cover types (B), and forest age (C) of the study area
Non-forest cover areas are masked in white. Map review number is GS (2020) 4619, same below.
![]()
图 2 总初级生产力(A)、生态系统呼吸(B)、净生态系统生产力(C)模拟值与观测值比较
GPP:总初级生产力;ER:生态系统呼吸;NEP:净生态系统生产力;OB:观测值;SIM:模拟值。
Figure 2. Comparison between simulated and observed values of gross primary productivity (A), ecosystem respiration (B), and net ecosystem productivity (C)
GPP: Gross primary productivity; ER: Ecosystem respiration; NEP: Net ecosystem productivity; OB: Observed value; SIM: Simulated value.
![]()
图 3 2002-2020年水源地GPP(A)、植被呼吸(B)、土壤呼吸(C)、NEP(D)年际变化特征
Figure 3. Interannual variation characteristics of GPP (A), vegetation respiration (B), soil respiration (C), and NEP (D) in the water source area from 2002 to 2020
![]()
图 4 2002-2020年水源地NEP平均值(A)、10年变化趋势(B)和变化显著性(C)空间分布特征
S1:极显著减少;S2:显著减少;S3:微减少;S4:无显著变化。
Figure 4. Spatial distribution characteristics of multi-year average of NEP (A), decade trend of NEP (B), and significance of changes in NEP (C) in the water source area from 2002 to 2020
S1: Extremely significant reduction; S2: Significant reduction; S3: Slight decrease; S4: Not significant.
![]()
图 5 2002-2020年水源地气候要素年际变化趋势
P:年总降水;T:年均温;R:日均总辐射。
Figure 5. Interannual variation trends in climate elements in the water source area from 2002 to 2020
P: Annual total precipitation; T: Mean annual temperature; R: Daily total radiation. Same below.
![]()
图 6 水源地不同指标相关系数的空间分布
结果已通过95%显著性检验,NEP、GPP、VR与日均总辐射(R)相关分析图通过99.9%的显著性检验。
Figure 6. Spatial distribution of correlation coefficients of different indicators in the water source area
Results have passed the 95% significance test. Correlation analysis figures of NEP, GPP, and VR with daily total radiation R have passed the 99.9% significance test.
![]()
图 7 水源地年均温(A)、年总降水(B)和日均总辐射(C)的空间变化趋势
Figure 7. Trends of mean annual temperature (A), annual total precipitation (B), and daily total radiation (C) in the water source area
-
[1] Masson-Delmotte VP,Zhai P,Pirani SL,Connors C,Péan S,et al. IPCC,2021:Summary for Policymakers. In:Climate Change 2021:the Physical Science Basis. Contribution of Working Group Ⅰ to the Sixth Assessment Report of the Intergovernmental Panel on Climate Change[M]. Cambridge:Cambridge University Press,2021:3−32.
[2] Bonan GB. Forests and climate change:forcings,feedbacks,and the climate benefits of forests[J]. Science,2008,320(5882):1444−1449. doi: 10.1126/science.1155121
[3] Tang YK,Jia C,Wang LN,Wen XF,Wang HM. Solar energy dominates and soil water modulates net ecosystem productivity and evapotranspiration across multiple timescales in a subtropical coniferous plantation[J]. Agric Forest Meteror,2021,300:108310. doi: 10.1016/j.agrformet.2020.108310
[4] Song J,Wan SQ,Piao SL,Knapp AK,Classen AT,et al. A meta-analysis of 1,119 manipulative experiments on terrestrial carbon-cycling responses to global change[J]. Nat Ecol Evol,2019,3(9):1309−1320. doi: 10.1038/s41559-019-0958-3
[5] Piao SL,He Y,Wang XH,Chen FH. Estimation of China’s terrestrial ecosystem carbon sink:methods,progress and prospects. Sci China Earth Sci,2022,65(4):641−651.
[6] 刘坤,张慧,孔令辉,乔亚军,胡梦甜. 陆地生态系统碳汇评估方法研究进展[J]. 生态学报,2023,43(10):4294−4307. Liu K,Zhang H,Kong LH,Qiao YJ,Hu MT. An overview of terrestrial ecosystem carbon sink assessment methods towards achieving carbon neutrality in China[J]. Acta Ecologica Sinica,2023,43(10):4294−4307.
[7] 翁升恒,张玉琴,姜冬昕,潘卫华,李丽纯,张方敏. 福建省森林植被NEP时空变化及影响因子分析[J]. 生态环境学报,2023,32(5):845−856. Weng SH,Zhang YQ,Jiang DX,Pan WH,Li LC,Zhang FM. Spatio-temporal changes and attribution analysis of net ecosystem productivity in forest ecosystem in Fujian province[J]. Ecology and Environmental Sciences,2023,32(5):845−856.
[8] Lyu JQ,Fu XH,Lu C,Zhang YY,Luo PP,et al. Quantitative assessment of spatiotemporal dynamics in vegetation NPP,NEP and carbon sink capacity in the Weihe River Basin from 2001 to 2020[J]. J Clean Prod,2023,428:139384. doi: 10.1016/j.jclepro.2023.139384
[9] Qi SY,Zhang HQ,Zhang M. Evolutionary characteristics of carbon sources/sinks in Chinese terrestrial ecosystems regarding to temporal effects and geographical partitioning[J]. Ecol Indic,2024,160:111923. doi: 10.1016/j.ecolind.2024.111923
[10] Liang L,Wang QJ,Qiu SY,Geng D,Wang SG. NEP estimation of terrestrial ecosystems in China using an improved CASA model and soil respiration model[J]. IEEE J Select Top Appl Earth Obser Remote Sens,2023,16:10203−10215. doi: 10.1109/JSTARS.2023.3325774
[11] 曹云,孙应龙,姜月清,万君. 黄河流域净生态系统生产力的时空分异特征及其驱动因子分析[J]. 生态环境学报,2022,31(11):2101−2110. Cao Y,Sun YL,Jiang YQ,Wan J. Analysis on temporal-spatial variations and driving factors of net ecosystem productivity in the Yellow River Basin[J]. Ecology and Environment Sciences,2022,31(11):2101−2110.
[12] Qiu SY,Liang L,Wang QJ,Geng D,Wu JJ,et al. Estimation of European terrestrial ecosystem NEP based on an improved CASA model[J]. IEEE J Select Top Appl Earth Obser Remote Sens,2023,16:1244−1255. doi: 10.1109/JSTARS.2022.3233128
[13] Feng X,Fan QB,Qu JJ,Ding XH,Niu ZR. Characteristics of carbon sources and sinks and their relationships with climate factors during the desertification reversal process in Yulin,China[J]. Front For Glob Change,2023,6:1288449. doi: 10.3389/ffgc.2023.1288449
[14] 赵宁,周蕾,庄杰,王永琳,周稳,等. 中国陆地生态系统碳源/汇整合分析[J]. 生态学报,2021,41(19):7648−7658. Zhao N,Zhou L,Zhuang J,Wang YL,Zhou W,et al. Integration analysis of the carbon sources and sinks in terrestrial ecosystems,China[J]. Acta Ecologica Sinica,2021,41(19):7648−7658.
[15] Sallaba F,Lehsten D,Seaquist J,Sykes MT. A rapid NPP meta-model for current and future climate and CO2 scenarios in Europe[J]. Ecol Model,2015,302:29−41. doi: 10.1016/j.ecolmodel.2015.01.026
[16] Verbeeck H,Samson R,Verdonck F,Lemeur R. Parameter sensitivity and uncertainty of the forest carbon flux model FORUG:a Monte Carlo analysis[J]. Tree Physiol,2006,26(6):807−817. doi: 10.1093/treephys/26.6.807
[17] Fang J,Shugart HH,Liu F,Yan XD,Song YK,Lv FC. FORCCHN V2.0:an individual-based model for predicting multiscale forest carbon dynamics[J]. Geosci Model Dev,2022,15(17):6863−6872. doi: 10.5194/gmd-15-6863-2022
[18] Fang J,Lutz JA,Wang LB,Shugart HH,Yan XD. Using climate-driven leaf phenology and growth to improve predictions of gross primary productivity in North American forests[J]. Glob Change Biol,2020,26(12):6974−6988. doi: 10.1111/gcb.15349
[19] Fang J,Lutz JA,Shugart HH,Yan XD,Xie WQ,Liu F. Improving intra-and inter-annual GPP predictions by using individual tree inventories and leaf growth dynamics[J]. J Appl Ecol,2021,58(10):2315−2328. doi: 10.1111/1365-2664.13960
[20] Fang J,Shugart HH,Wang LB,Lutz JA,Yan XD,Liu F. Optimal representation of spring phenology on photosynthetic productivity across the northern hemisphere forests[J]. Agric Forest Meteor,2024,350:109975. doi: 10.1016/j.agrformet.2024.109975
[21] Niu PT,Zhang EC,Feng Y,Peng PH. Spatial-temporal pattern analysis of land use and water yield in water source region of middle route of South-to-North water transfer project based on Google Earth Engine[J]. Water,2022,14(16):2535. doi: 10.3390/w14162535
[22] 刘海,黄跃飞,郑粮. 气候与人类活动对丹江口水源区植被覆盖变化的影响[J]. 农业工程学报,2020,36(6):97−105. doi: 10.11975/j.issn.1002-6819.2020.06.012 Liu H,Huang YF,Zheng L. Effects of climate and human activities on vegetation cover changes in Danjiangkou water source areas[J]. Transactions of the Chinese Society of Agricultural Engineering,2020,36(6):97−105. doi: 10.11975/j.issn.1002-6819.2020.06.012
[23] 刘洋. 南水北调中线工程水源地径流对气候变化和土地利用变化的响应[D]. 北京:中国科学院大学,2021:14−16. [24] 刘金宝,刘轩,孙增慧,赵永华,王博. 丹江口水库土地利用与水质变化响应关系研究[J]. 遥感技术与应用,2023,38(2):285−296. Liu JB,Liu X,Sun ZH,Zhao YH,Wang B. Study on the relationship between land use and water quality change in Danjiangkou reservoir[J]. Remote Sensing Technology and Application,2023,38(2):285−296.
[25] Jiang QH,Chen YY,Hu JL,Liu F. Use of visible and near-infrared reflectance spectroscopy models to determine soil erodibility factor (K) in an ecologically restored watershed[J]. Remote Sens,2020,12(18):3103. doi: 10.3390/rs12183103
[26] Wang YD,Liu XL,Wang T,Zhang XY,Feng YZ,et al. Relating land-use/land-cover patterns to water quality in watersheds based on the structural equation modeling[J]. Catena,2021,206:105566. doi: 10.1016/j.catena.2021.105566
[27] 胡圣,夏凡,张爱静,龚治娟,周正,王英才. 丹江口水源区水生态功能一二级分区研究[J]. 长江流域资源与环境,2017,26(8):1208−1217. doi: 10.11870/cjlyzyyhj201708011 Hu S,Xia F,Zhang AJ,Gong ZJ,Zhou Z,Wang YC. Level Ⅰ and Ⅱ aquatic eco-regionalization in the water source area of Danjiangkou reservoir[J]. Resources and Environment in the Yangtze Basin,2017,26(8):1208−1217. doi: 10.11870/cjlyzyyhj201708011
[28] Gao WW,Zeng Y,Liu Y,Wu BF. Human activity intensity assessment by remote sensing in the water source area of the middle route of the South-to-North Water Diversion project in China[J]. Sustainability,2019,11(20):5670. doi: 10.3390/su11205670
[29] Yuan J,Jose S,Hu ZY,Pang JZ,Hou L,Zhang SX. Biometric and eddy covariance methods for examining the carbon balance of a Larix principis-rupprechtii forest in the Qinling Mountains,China[J]. Forests,2018,9(2):67. doi: 10.3390/f9020067
[30] Cheng K,Chen YL,Xiang TY,Yang HT,Liu WY,Ren Y,et al. A 2020 forest age map for China with 30 m resolution[J]. Earth Syst Sci Data,2024,16(2):803−819. doi: 10.5194/essd-16-803-2024
[31] 延晓冬,赵俊芳. 基于个体的中国森林生态系统碳收支模型FORCCHN及模型验证[J]. 生态学报,2007,27(7):2684−2694. doi: 10.3321/j.issn:1000-0933.2007.07.004 Yan XD,Zhao JF. Establishing and validation individual-based carbon budget model FORCCHN of forest ecosystems in China[J]. Acta Ecologica Sinica,2007,27(7):2684−2694. doi: 10.3321/j.issn:1000-0933.2007.07.004
[32] Parton WJ,Scurlock JMO,Ojima DS,Gilmanov TG,Scholes RJ,et al. Observations and modeling of biomass and soil organic matter dynamics for the grassland biome worldwide[J]. Global Biogeochem Cycles,1993,7(4):785−809. doi: 10.1029/93GB02042
[33] Duan HC,Xue X,Wang T,Kang WP,Liao J,Liu SL. Spatial and temporal differences in alpine meadow,alpine steppe and all vegetation of the Qinghai-Tibetan Plateau and their responses to climate change[J]. Remote Sens,2021,13(4):669. doi: 10.3390/rs13040669
[34] Yang C,Zhai GH,Fu MC,Sun C. Spatiotemporal characteristics and influencing factors of net primary production from 2000 to 2021 in China[J]. Environ Sci Pollut Res,2023,30(39):91084−91094. doi: 10.1007/s11356-023-28666-8
[35] Guo W,Ni XN,Jing DY,Li SH. Spatial-temporal patterns of vegetation dynamics and their relationships to climate variations in Qinghai Lake Basin using MODIS time-series data[J]. J Geogr Sci,2014,24(6):1009−1021. doi: 10.1007/s11442-014-1134-y
[36] Mu SJ,Yang HF,Li JL,Chen YZ,Gang CC,et al. Spatio-temporal dynamics of vegetation coverage and its relationship with climate factors in Inner Mongolia,China[J]. J Geogr Sci,2013,23(2):231−246. doi: 10.1007/s11442-013-1006-x
[37] 黄志霖,肖文发. 生物群区和林龄对森林土壤呼吸及其组分的影响[J]. 生态学报,2008,28(9):4078−4087. doi: 10.3321/j.issn:1000-0933.2008.09.003 Huang ZL,Xiao WF. Biome and stand ages impacts on soil CO2 efflux and partitioning:a global trends[J]. Acta Ecologica Sinica,2008,28(9):4078−4087. doi: 10.3321/j.issn:1000-0933.2008.09.003
[38] Chasmer L,Kljun N,Barr A,Black A,Hopkinson C,et al. Influences of vegetation structure and elevation on CO2 uptake in a mature jack pine forest in Saskatchewan,Canada[J]. Can J For Res,2008,38(11):2746−2761. doi: 10.1139/X08-121
[39] Wang J,Dong J,Yi Y,Lu G,Oyler J,et al. Decreasing net primary production due to drought and slight decreases in solar radiation in China from 2000 to 2012[J]. J Geophys Res Biogeosci,2017,122(1):261−278. doi: 10.1002/2016JG003417
[40] Sun R,Chen SH,Su HB,Hao GB. Spatiotemporal variation of vegetation coverage and its response to climate change before and after implementation of grain for green project in the Loess Plateau[C]//IGARSS 2019-2019 IEEE International Geoscience and Remote Sensing Symposium. Yokohama:IEEE,2019:9546−9549.
[41] Zhang CL,Huang N,Wang L,Song WJ,Zhang YL,Niu Z. Spatial and temporal pattern of net ecosystem productivity in China and its response to climate change in the past 40 years[J]. Int J Environ Res Public Health,2022,20(1):92. doi: 10.3390/ijerph20010092
[42] 荣艳淑,张行南,姜海燕,白路遥. 长江上游区域蒸发皿蒸发量变化及其对水分循环的影响[J]. 地球物理学报,2012,55(9):2889−2897. doi: 10.6038/j.issn.0001-5733.2012.09.008 Rong YS,Zhang XN,Jiang HY,Bai LY. Pan evaporation change and its impact on water cycle over the upper reach of the Yangtze River[J]. Chinese Journal of Geophysics,2012,55(9):2889−2897. doi: 10.6038/j.issn.0001-5733.2012.09.008
[43] 张静,吴洁,秦公伟,冯俊霄,郑博,赵文博. 秦巴山区地表太阳辐射的时空动态及农业气候区划研究[J]. 地理科学,2020,40(10):1742−1752. Zhang J,Wu J,Qin GW,Feng JX,Zheng B,Zhao WB. Spatio-temporal dynamics of surface solar radiation and agroclimatic zoning in the Qinling-Bashan Mountains[J]. Scientia Geographica Sinica,2020,40(10):1742−1752.
[44] Huang N,Wang L,Song XP,Black TA,Jassal RS,et al. Spatial and temporal variations in global soil respiration and their relationships with climate and land cover[J]. Sci Adv,2020,6(41):eabb8508. doi: 10.1126/sciadv.abb8508
 下载:
下载:


计量
- 文章访问数: 176
- HTML全文浏览量: 56
- PDF下载量: 24
