
Above-ground removal of plant functional groups on soil nematode communities in alpine meadows on the Qinghai-Tibet Plateau
-
摘要:
土壤线虫对高寒草甸生态系统功能有重要的指示作用,植物功能群丧失对土壤线虫群落的影响尚不清楚。本研究在青藏高原东部的高寒草甸生态系统中设置对照、保留豆科、保留禾状草、保留非豆科杂类草和去除所有植物功能群5个处理的地上部植物功能群去除实验,以探究植物功能群损失对土壤线虫群落的影响。结果显示:(1)去除植物功能群地上部对植物根系生物量和土壤线虫总密度影响不显著。(2)去除植物功能群地上部对线虫不同营养类群相对丰度影响显著。保留豆科处理下,食细菌线虫相对丰度整体最高,而植物寄生线虫相对丰度最低;保留杂类草处理下,植物寄生线虫相对丰度整体最高,而食细菌线虫相对丰度最低。(3)非度量多维尺度分析(NMDS)结果表明,去除不同植物功能群会导致土壤线虫类群产生差异,对土壤线虫群落结构产生显著影响。
Abstract:Soil nematodes play an important role in indicating the structure and function of alpine meadow ecosystems, yet the impact of plant functional group loss on soil nematode communities remains unclear. In this study, five treatments involving the removal of above-ground plant functional groups were established in an alpine meadow ecosystem of the eastern Qinghai-Tibet Plateau, including a control (CK), graminoids, legumes, forbs, and remove all. The aim was to explore the impact of plant functional group loss on soil nematode communities. Results showed that: (1) Above-ground removal of plant functional groups had no significant effect on plant root biomass and soil nematode total density. (2) Above-ground removal of plant functional groups had a significant effect on the relative abundance of nematode trophic taxa. Under legume treatment, the relative abundance of bacterial feeder nematodes was the highest, while that of plant parasite nematodes was the lowest; under forbs treatment, the relative abundance of plant parasite nematodes was the highest, while that of bacterial feeder nematodes was the lowest. (3) Nonmetric multidimensional-scaling analysis (NMDS) showed that the removal of different plant functional groups led to differences in soil nematode taxa, with significant impact on soil nematode community structure.
-
青藏高原有世界“第三极”之称,其生态环境对全球气候变化极其敏感[1]。高寒草甸作为青藏高原的主要生态系统之一,具有丰富的物种资源[2],是全球变化背景下生物多样性研究热点区域之一。近年来,由于全球气候变化以及过度放牧等人为活动的干扰,青藏高原高寒草甸生态系统退化日趋严重,植物多样性降低带来的生态风险越来越引起重视[3, 4]。
植物物种的丧失并不是随机的,而往往与植物功能群相关[5]。青藏高原植被以莎草科线叶嵩草(Carex capillifolia (Decne.) S. R. Zhang)为优势种,禾本科垂穗披碱草(Elymus nutans Griseb)、异针茅(Stipa aliela Keng)、杂类草重冠紫菀(Aster diplostephioides (DC.) CB Clarke)、小花草玉梅(Anemone rivularis Buch. Ham.)和豆科植物披针叶黄华(Thermopsis lanceolata R. Br.)为伴生种[6]。有研究表明,牲畜的选择性取食导致禾状草的损失[7],施肥导致低竞争优势杂类草物种的丧失[8],围封禁牧则会限制杂类草的生长[9]。依据植物养分利用策略的差异,一般将青藏高原地区植物划分为豆科、杂类草、禾状草3大功能群。豆科与固氮菌共生,可以增加土壤氮养分含量[10];杂类草往往具有更大的叶面积,而禾状草叶面积小,因此通常杂类草相对于禾状草对养分的需求更大[11]。不同植物功能群对养分利用等生态功能的差异,可能会导致特定植物功能群丧失后对土壤生物群落产生不同的影响。
土壤线虫在土壤食物网中占据多个营养级[12],是土壤养分循环的直接参与者之一[13, 14]。土壤线虫世代周期短,能够对环境变化做出快速反应[15],因此,被广泛用作生态系统结构和功能的指示生物[16]。研究发现,植物功能群能显著影响土壤线虫群落 [17]。如Viketoft [18]通过研究不同植物对线虫群落的影响发现,禾本科和豆科植物有利于提高食细菌线虫的数量。Ye等[19]通过探究不同施氮水平下禾本科和豆科单一或混合栽培对线虫影响的实验发现,与禾本科相比,豆科单作和豆科-禾本科混作更有利于食细菌、食真菌和植物寄生线虫密度的增加。
然而,在青藏高原高寒草甸生态系统中,土壤有机质含量高,土壤养分不是主要限制因子,不同功能群植物对养分吸收利用策略的差异是否仍会导致线虫群落的变化还不清楚。因此,本研究通过去除实验,探究高寒草甸不同植物功能群去除下土壤线虫群落的差异,研究结果有助于评估植物多样性变化对土壤食物网结构和功能的影响,并揭示高寒草甸生态系统植被变化情况下生态功能的改变。
1. 材料与方法
1.1 研究区概况
研究样地设置在甘肃省玛曲县青藏高原东部的高寒草甸生态系统,位于甘南草原生态系统国家野外科学观测研究站(33°40'N,101°53'E),平均海拔为3 550 m。全年日照约2 580 h,霜期超过270 d,年平均气温1.8 ℃,年平均降水量为593 mm[6]。土壤类型为亚高山草甸土,属湿润寒冷的高原气候[20]。植被类型是以多年生莎草科线叶嵩草为优势种的高寒草甸,主要包括禾状草、豆科和非豆科杂类草。
1.2 样地设置
实验样地于2018年8月建立。该研究按生活型将植被分为3个功能群[21, 22]:(1)禾状草(Graminoids,包括禾本科和莎草科),主要有垂穗披碱草、线叶嵩草、异针茅;(2)豆科(Legumes),主要有披针叶黄华、青海苜蓿(Medicago archiducis-nicolai Sirj.);(3)非豆科杂类草(Non-legume Forbs),主要有重冠紫菀、小花草玉梅、瑞苓草(Saussurea nigrescens Maxim.)。连续去除3年后,禾状草生物量约占总生物量的58%,杂类草约占总生物量的41%,豆科植物约占总生物量的1%。实验设置以下5个处理:对照(CK,不去除任何植物功能群);保留豆科(Legumes,去除禾状草和非豆科杂类草);保留禾状草(Graminoids,去除豆科和非豆科杂类草);保留非豆科杂类草(Forbs,去除禾状草和豆科植物);去除所有植物功能群(Remove all)。
实验采取拉丁方设计,设置5个样区作为重复,共 25个样方。样方大小为1.5 m×1.5 m,为了减少边际效应,在样方之间留1 m 左右的缓冲带。在每年生长季开始(4月中旬)后对植物功能群进行去除,用剪刀齐地表剪除目标功能群的地上部分,并将其移出样方。2018年进行了1次去除处理;2019年5-8月每月处理2次,全年共8次;2020年6、7、8月各1次,全年共3次;2021年7月初、7月末、8月各1次,全年共3次。多次去除直到植物被完全移除,以停止(或至少显著抑制)生长。
1.3 土壤样品采集和线虫分离鉴定
土壤样品采集时间为2021年9月,每个样方划分为9个小样方,随机选取其中1个小样方采用五点取样法进行采样,即用不锈钢土钻在每个样方的四个角和中心点进行采样,土层深度0 ~ 10 cm,并将这5钻土壤混合为1个样品;共获得25个土壤样品。将样品带回实验室,每个样品立即取10 g左右鲜土放入铝盒, 105 ℃烘至恒重,测土壤含水量。
采用改良浅盘法[23]对土壤线虫进行分离。取80 g鲜土均匀铺在线虫滤纸上,加水刚好浸没过土壤样品表面,于室温下静置48 h。收集浅盘中的悬浊液,过500目双层筛8次,多次用清水冲洗筛子,将筛子上的线虫收集于培养皿中。通过体视显微镜进行计数,利用土壤含水量计算每100 g干土中线虫的数量,并从中随机抽取100条在光学显微镜下进行鉴定,总数不足100条时,全部进行鉴定。根据口器、食道和尾形等特征对线虫进行形态学鉴定,依据鉴定结果将其划分4个营养类群: 食细菌线虫(Bacterial feeders,BF)、食真菌线虫(Fungal feeders,FF)、植物寄生线虫(Plant parasites,PP)和捕/杂食线虫(Omnivores-predators,OP)[12]。按照线虫生活史策略划分为r-对策者向k-对策者过渡的5个类群,即不同的cp值线虫[24]。土壤线虫的分类鉴定参照Bongers的分类图鉴De Nematoden van Nederland[25]和线虫图片库 (https://nematode. unl. edu)进行。提取完线虫的土壤样品用于收集植物根系,将土样置于80目筛子,用流水冲洗至无土壤颗粒,放入信封,60 ℃烘干至恒重,用于根系生物量的测定。
1.4 数据分析
根据线虫各类群密度占总密度的比例来划分数量等级,10% 以上的为优势类群,1%~10%的为常见类群,1%以下的为稀有类群。
在属的水平上,计算土壤线虫各类群数,并按以下公式分析线虫生态指数[26-28]:
香农−维纳多样性指数(Shannon−Wiener index):
H′=−∑Pi×ln(Pi) (1) 均匀度指数(Pielou evenness index):
J′=H′/ln(S) (2) 优势度指数(Simpson dominance index):
λ=∑P2i (3) 丰富度指数(Margalef richness index):
SR=(S−1)/lnN (4) 式中,Pi为第i个分类单元中个体所占的比例,S为所鉴定属的数量,N为鉴定的线虫个体数目。
线虫通路比值(Nematode channel ratio):
NCR=B/(B+F) (5) 式中,B为食细菌线虫的相对丰度,F为食真菌线虫的相对丰度。
富集指数(Enrichment index,EI):
EI=100×(e/(e+b)) (6) 结构指数(Structure index,SI):
SI=100×(s/(s+b)) (7) 通道指数(Channel index,CI):
CI=100×0.8Fu2/(0.8Fu2+3.2Ba1) (8) 式中e(Enrichment)代表食物网中的富集成分,包括食细菌线虫中cp值为1和食真菌线虫中cp值为2的类群;b(Basal)代表食物网中的基础成分,包括食细菌线虫和食真菌线虫中cp值为2的类群;s(Structure)代表食物网中的结构成分,包括食细菌线虫、食真菌线虫中cp值为3~5的类群以及捕/杂食线虫中cp值为2~5的类群。b、e和s对应的值分别为
∑kbnb 、∑kene 和∑ksns ,其中kb、ke和ks为各类群所对应的加权数(其值在0.8~5.0),而nb、ne和ns则为各类群的相对多度。Fu2为食真菌线虫中cp值为2的类群, Ba1为食细菌线虫中cp值为1的类群。线虫数据和生态指标采用Excel 2016软件进行整理计算。利用R 4.2.1软件lmerTest包[29]中的lmer函数拟合线性混合模型,以实验植物功能群去除为固定因素,样方所在区组为随机因素。利用stats包[30]anova函数分析植物功能群去除处理对土壤线虫密度、营养类群、线虫生态指数等的影响。若差异显著,再用multcomp包[31] 的glht函数进行多重比较。用vegan包[32]中的metaMDS函数和adonis2函数进行Beta多样性差异分析,对差异显著的数据用pairwise.adonis函数进行PERMANOVA分析。采用ggplot2包[33]作图。
2. 结果与分析
2.1 植物根系生物量和土壤线虫密度
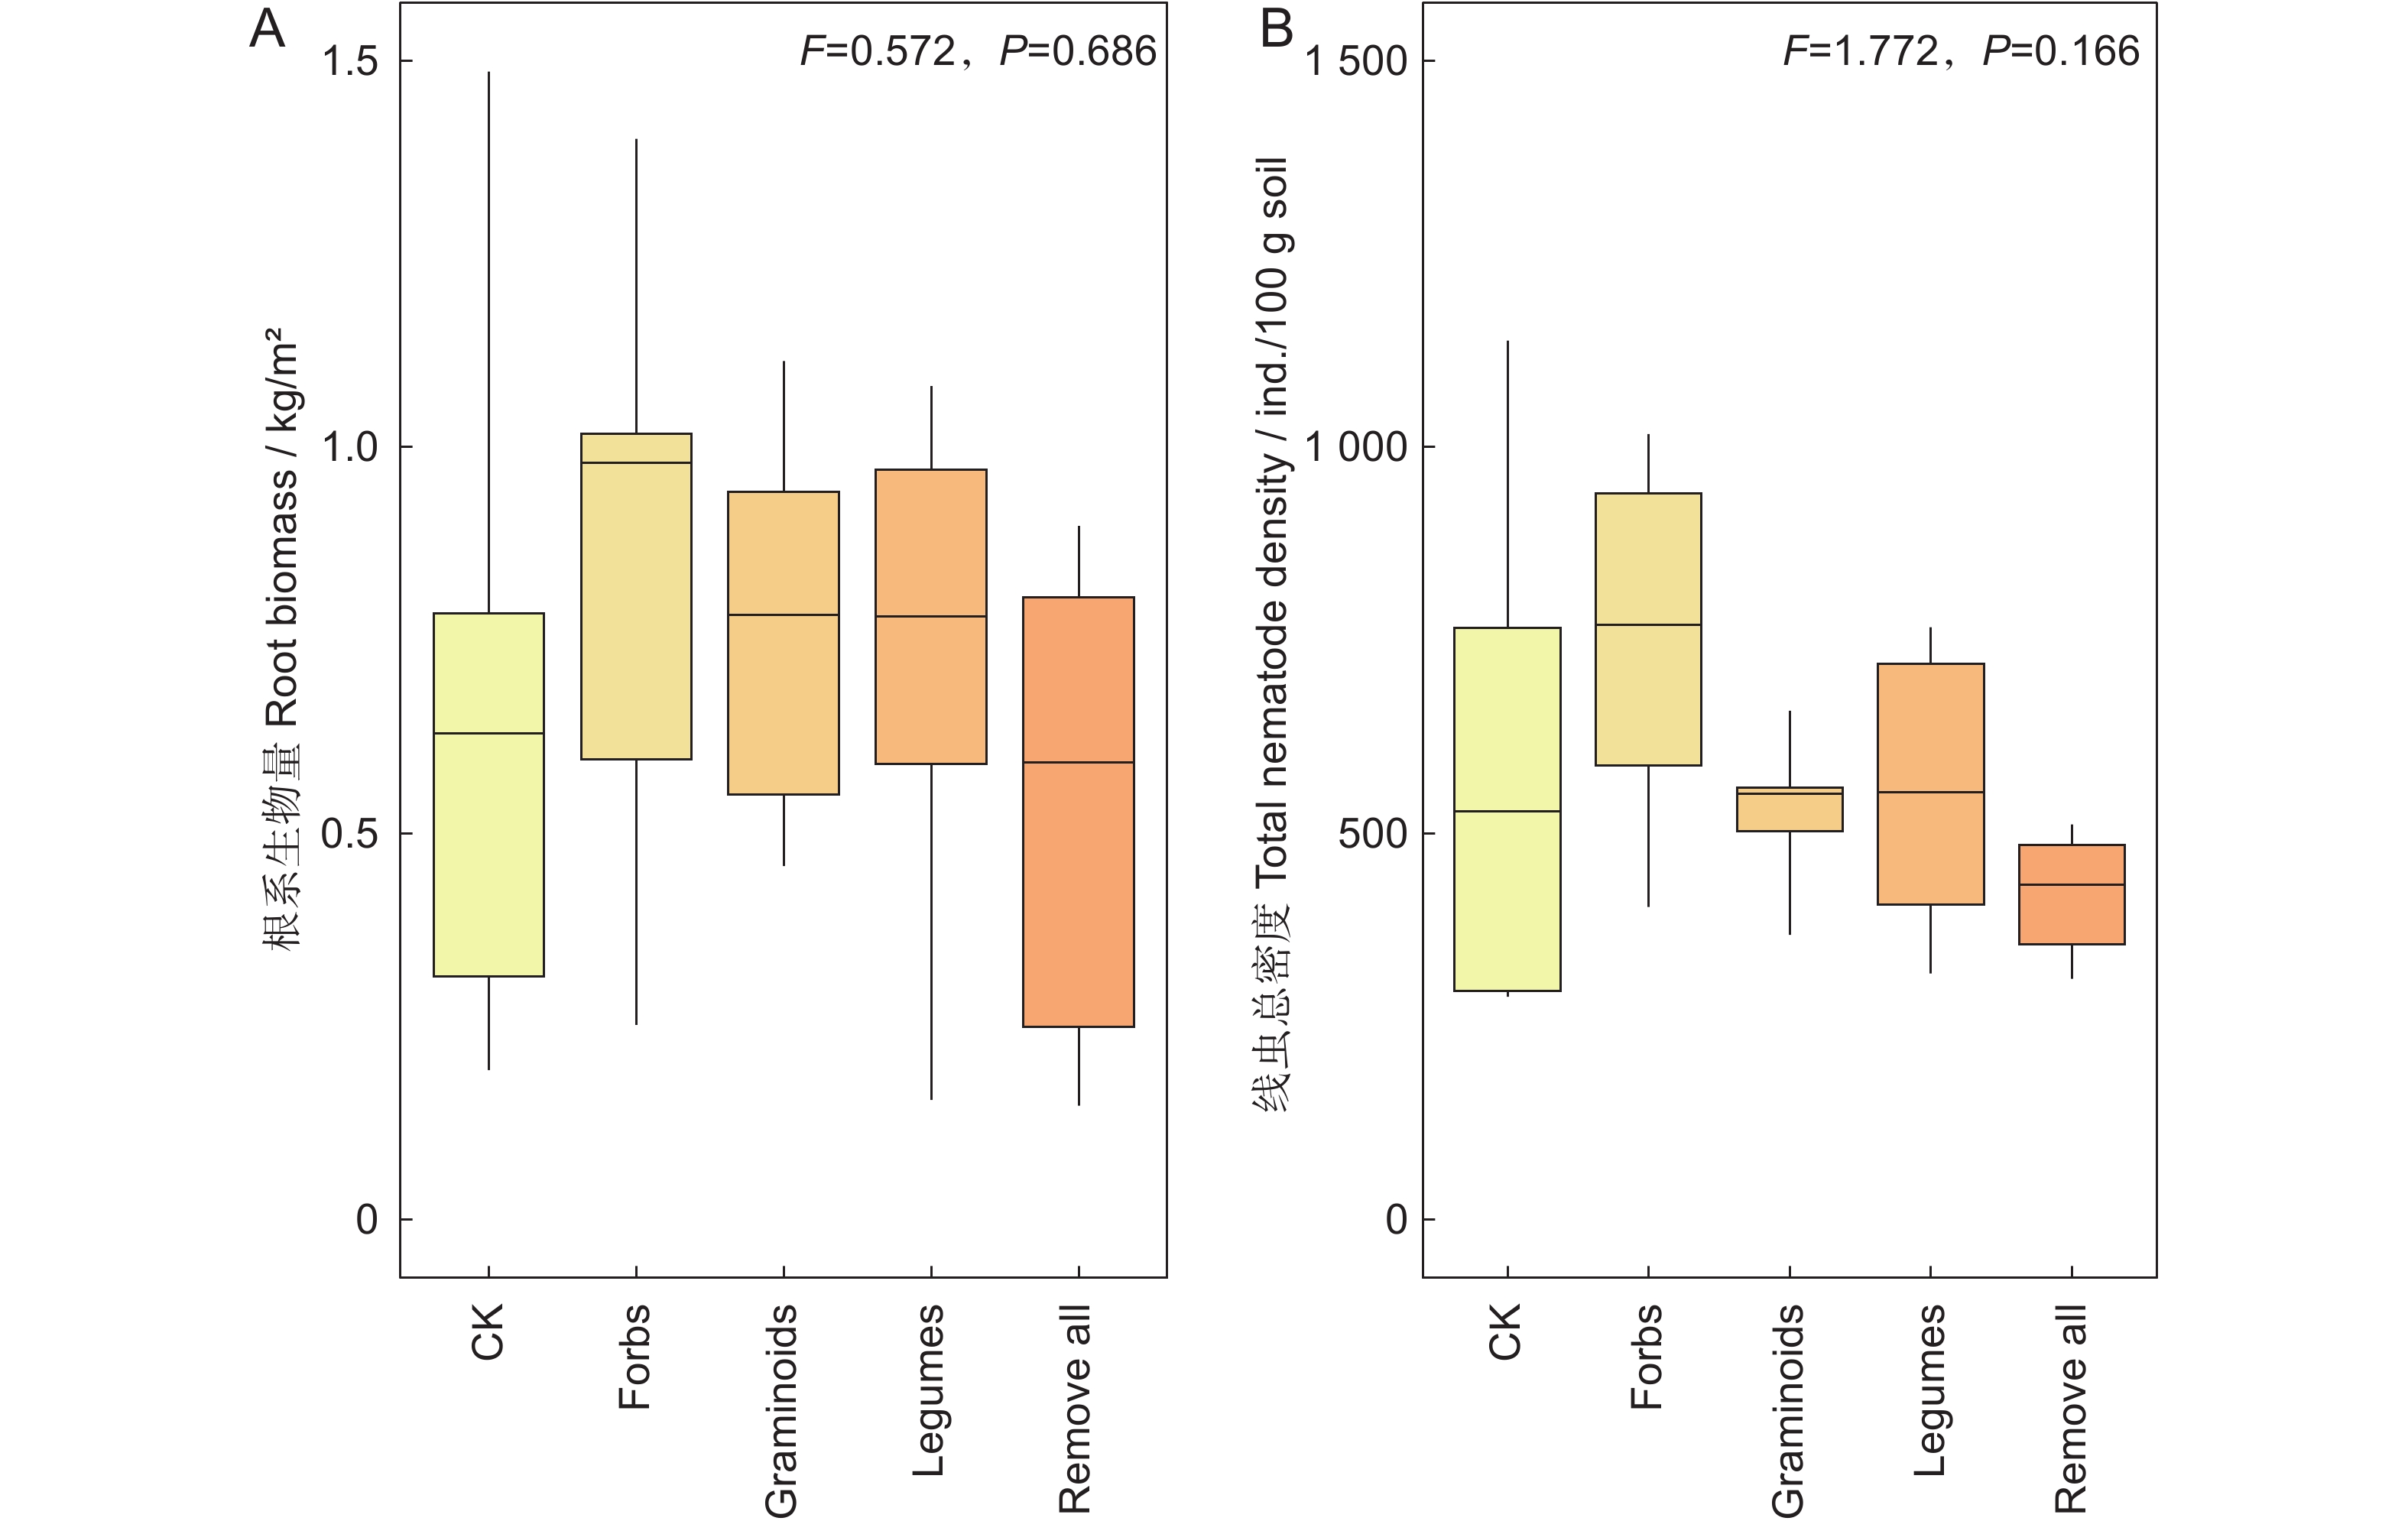
研究结果表明,植物功能群去除对地下根系生物量和土壤线虫总密度没有显著影响(图1)。植物根系生物量在所有保留单一植物功能群处理中均有上升趋势,但并无显著差异(图1:A)。
![]() 图 1 不同处理下根系生物量(A)和线虫总密度(B)CK表示对照,Forbs表示保留非豆科杂类草,Graminoids表示保留禾状草,Legumes表示保留豆科,Remove all表示去除所有植物功能群。下同。Figure 1. Root biomass (A) and total density of nematodes (B) under different treatmentsCK, control; Forbs, only non-legume forbs; Graminoids, only graminoids; Legumes, only legumes; Remove all, all plant functional groups removed. Same below.
图 1 不同处理下根系生物量(A)和线虫总密度(B)CK表示对照,Forbs表示保留非豆科杂类草,Graminoids表示保留禾状草,Legumes表示保留豆科,Remove all表示去除所有植物功能群。下同。Figure 1. Root biomass (A) and total density of nematodes (B) under different treatmentsCK, control; Forbs, only non-legume forbs; Graminoids, only graminoids; Legumes, only legumes; Remove all, all plant functional groups removed. Same below.保留杂类草功能群下土壤线虫总密度有上升趋势,保留禾状草和豆科功能群下,土壤线虫总密度有下降趋势,但与对照之间的差异并未达到显著水平(图1:B)。
保留杂类草处理下,去除的禾状草生物量显著大于豆科植物;保留禾状草处理下,去除的杂类草生物量显著大于豆科植物;保留豆科植物处理下,去除的杂类草和禾状草生物量无显著差异;去除所有植物功能群处理下,去除的杂类草和禾状草生物量显著大于豆科植物(表1)。
表 1 不同处理下去除的植物功能群生物量Table 1. Plant functional group biomass removed under different treatments处理
Treatment杂类草
Forbs禾状草
Graminoids豆科植物
Legumes对照 − − − 保留杂类草 − 250.526±24.045a 4.482±1.010b 保留禾状草 130.184±18.125a − 3.276±1.259b 保留豆科植物 292.600±23.032a 334.168±24.688a − 去除所有 318.982±49.623a 455.814±39.827a 5.684±2.320b 注:表中数据均为平均值±标准误。每处理5个重复。同行不同小写字母表示不同功能群生物量在同一处理下差异显著(P<0.05)。 Notes: All data are average values±SD. Each treatment has five replicates. Different lowercase letters in the same row indicate significant differences in biomass of different functional groups under the same treatment at the 0.05 level. 2.2 土壤线虫的营养类群
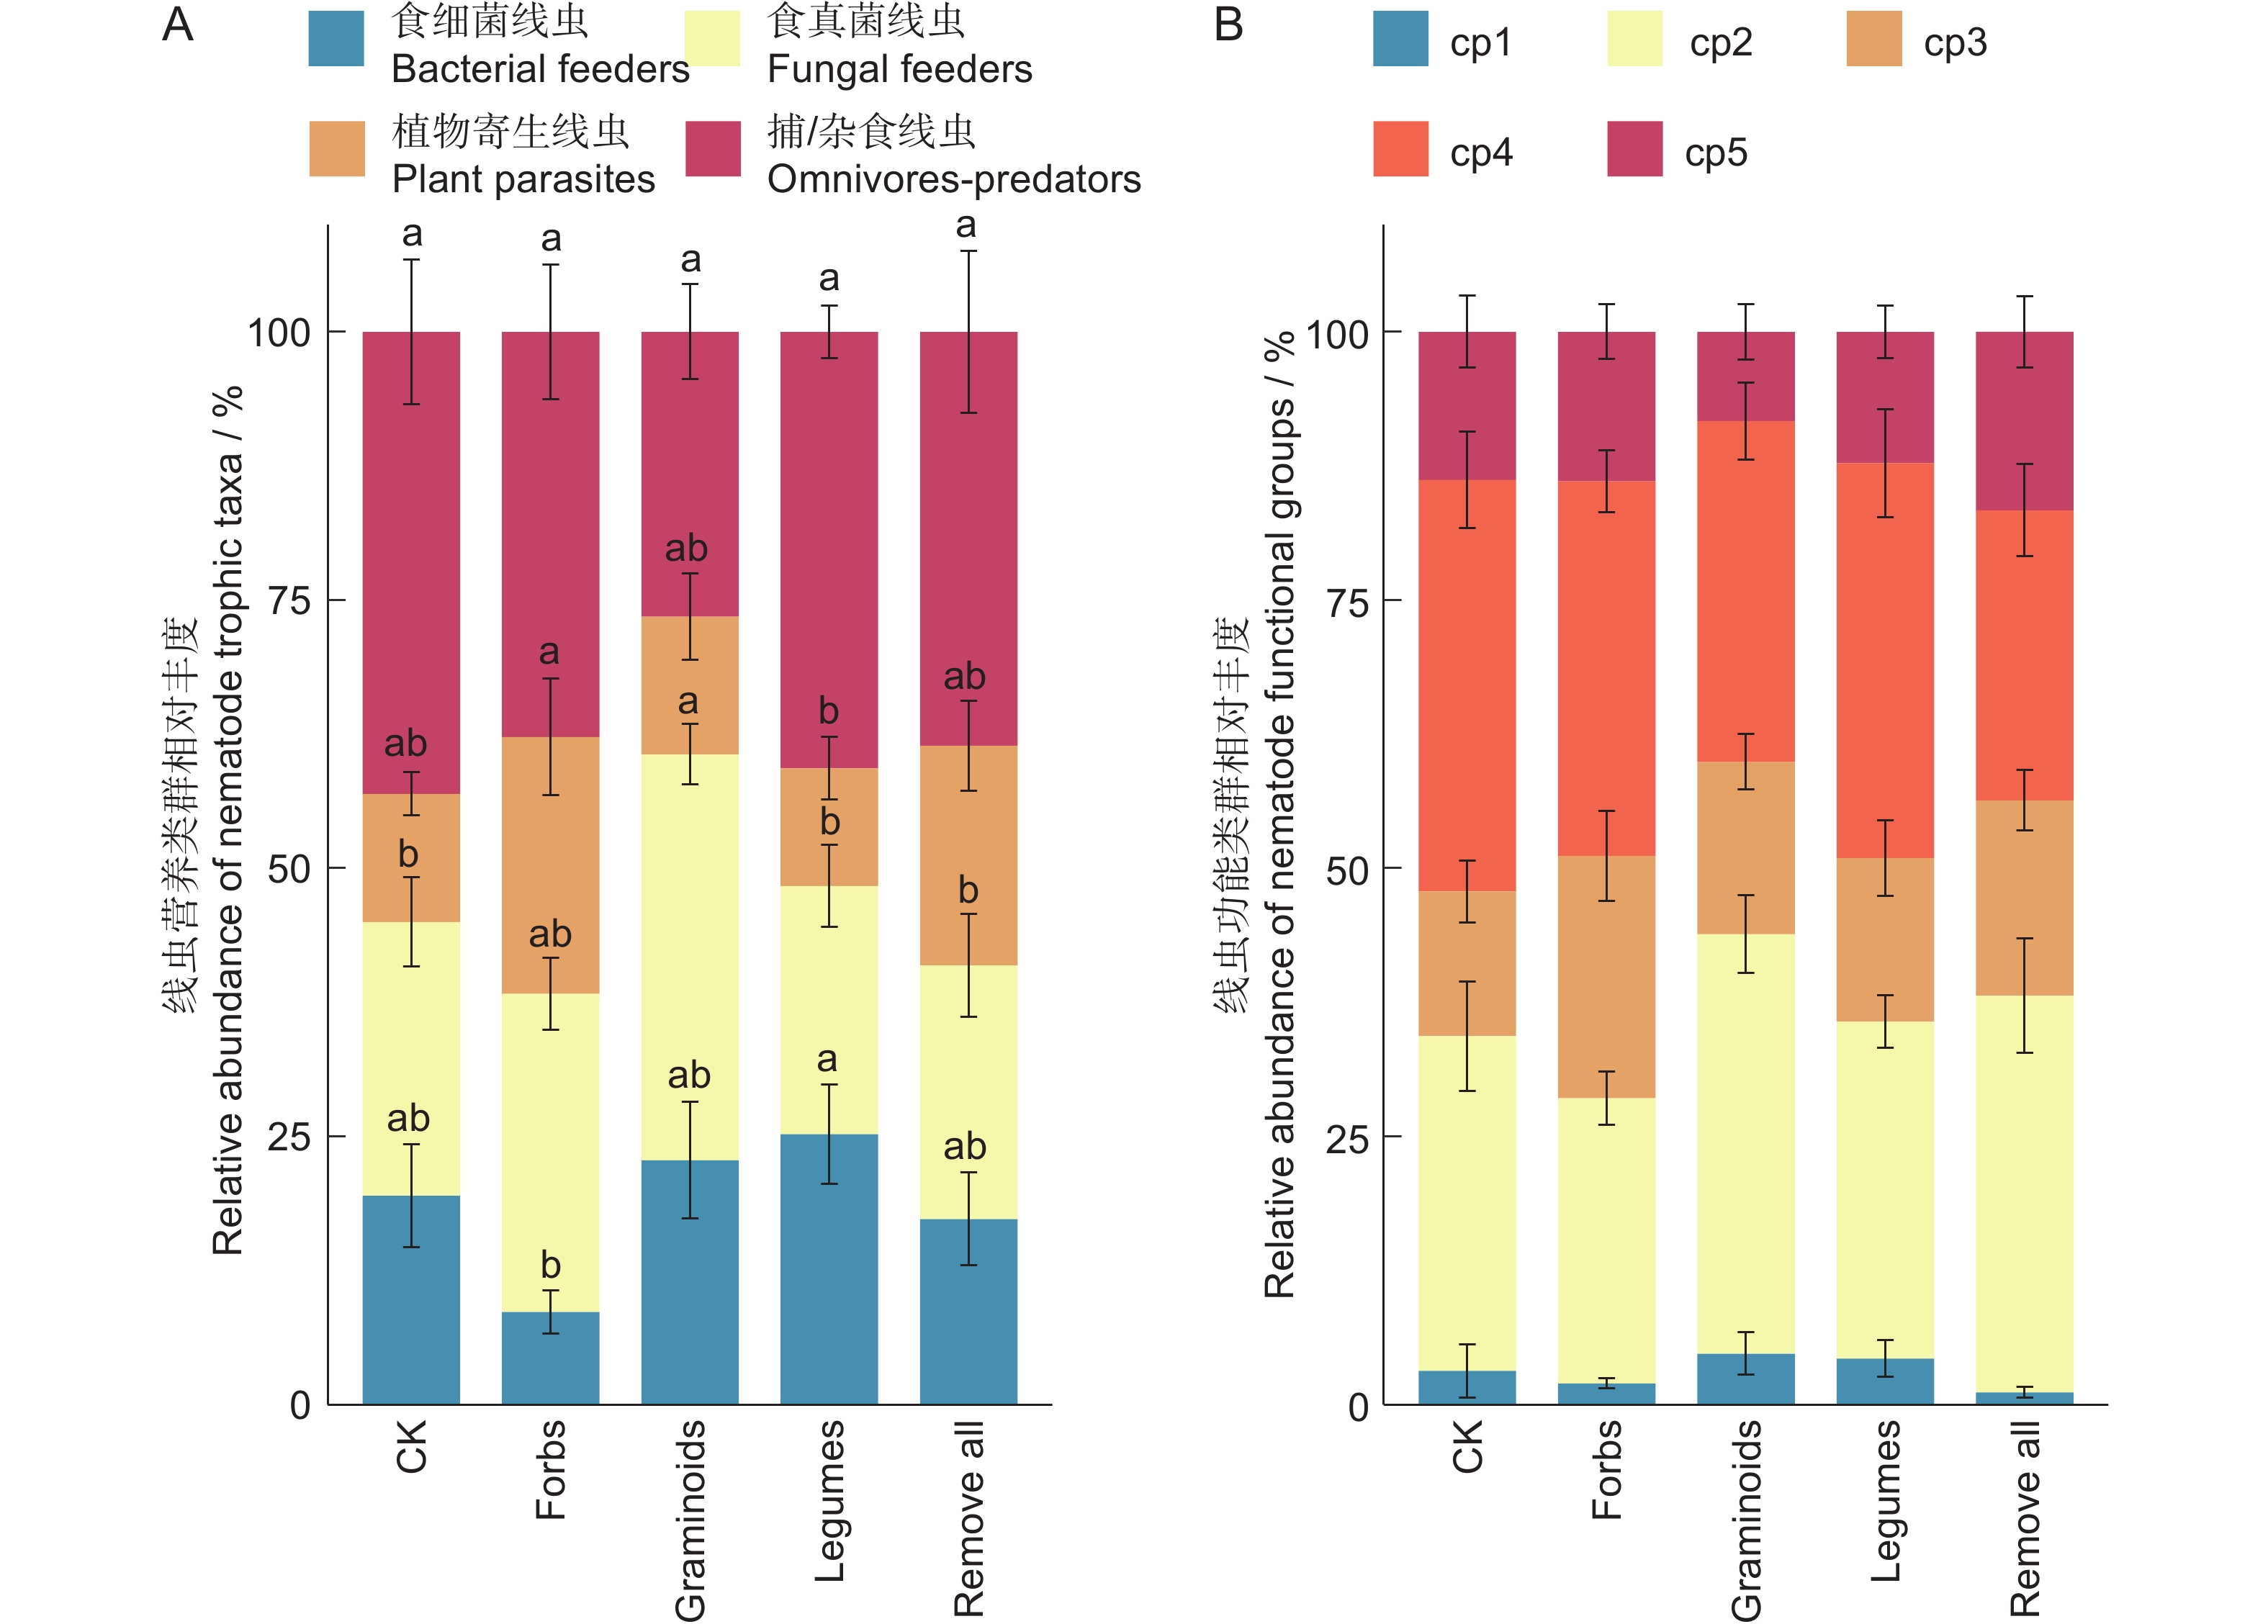
分析结果表明,植物功能群去除对不同营养类群线虫的相对丰度影响显著(图2)。保留豆科植物处理下,食细菌线虫的相对丰度显著大于保留杂类草处理;保留禾状草处理下,食真菌线虫的相对丰度显著大于对照、保留豆科植物处理以及去除所有植物功能群处理;保留杂类草处理下,植物寄生线虫的相对丰度显著大于保留豆科植物处理。不同植物功能去除对捕/杂食性线虫的相对丰度无显著影响(图2:A)。对照、保留杂类草和去除所有植物功能群3种处理,均表现为捕/杂食性线虫和食真菌线虫的相对丰度较高,而食细菌线虫和植物寄生线虫的相对丰度较低。不同植物功能群去除对线虫不同cp值类群的相对丰度无显著影响(图2:B)。
![]() 图 2 不同处理下线虫营养类群(A)和功能类群(B)的相对丰度不同小写字母表示不同处理间相同线虫营养类群的差异显著(P<0.05)。下同。Figure 2. Relative abundance of nematode trophic taxa (A) and functional groups (B) under different treatmentsDifferent lowercase letters indicate differences in same nematode trophic taxa among treatments at the 0.05 level. Same below.
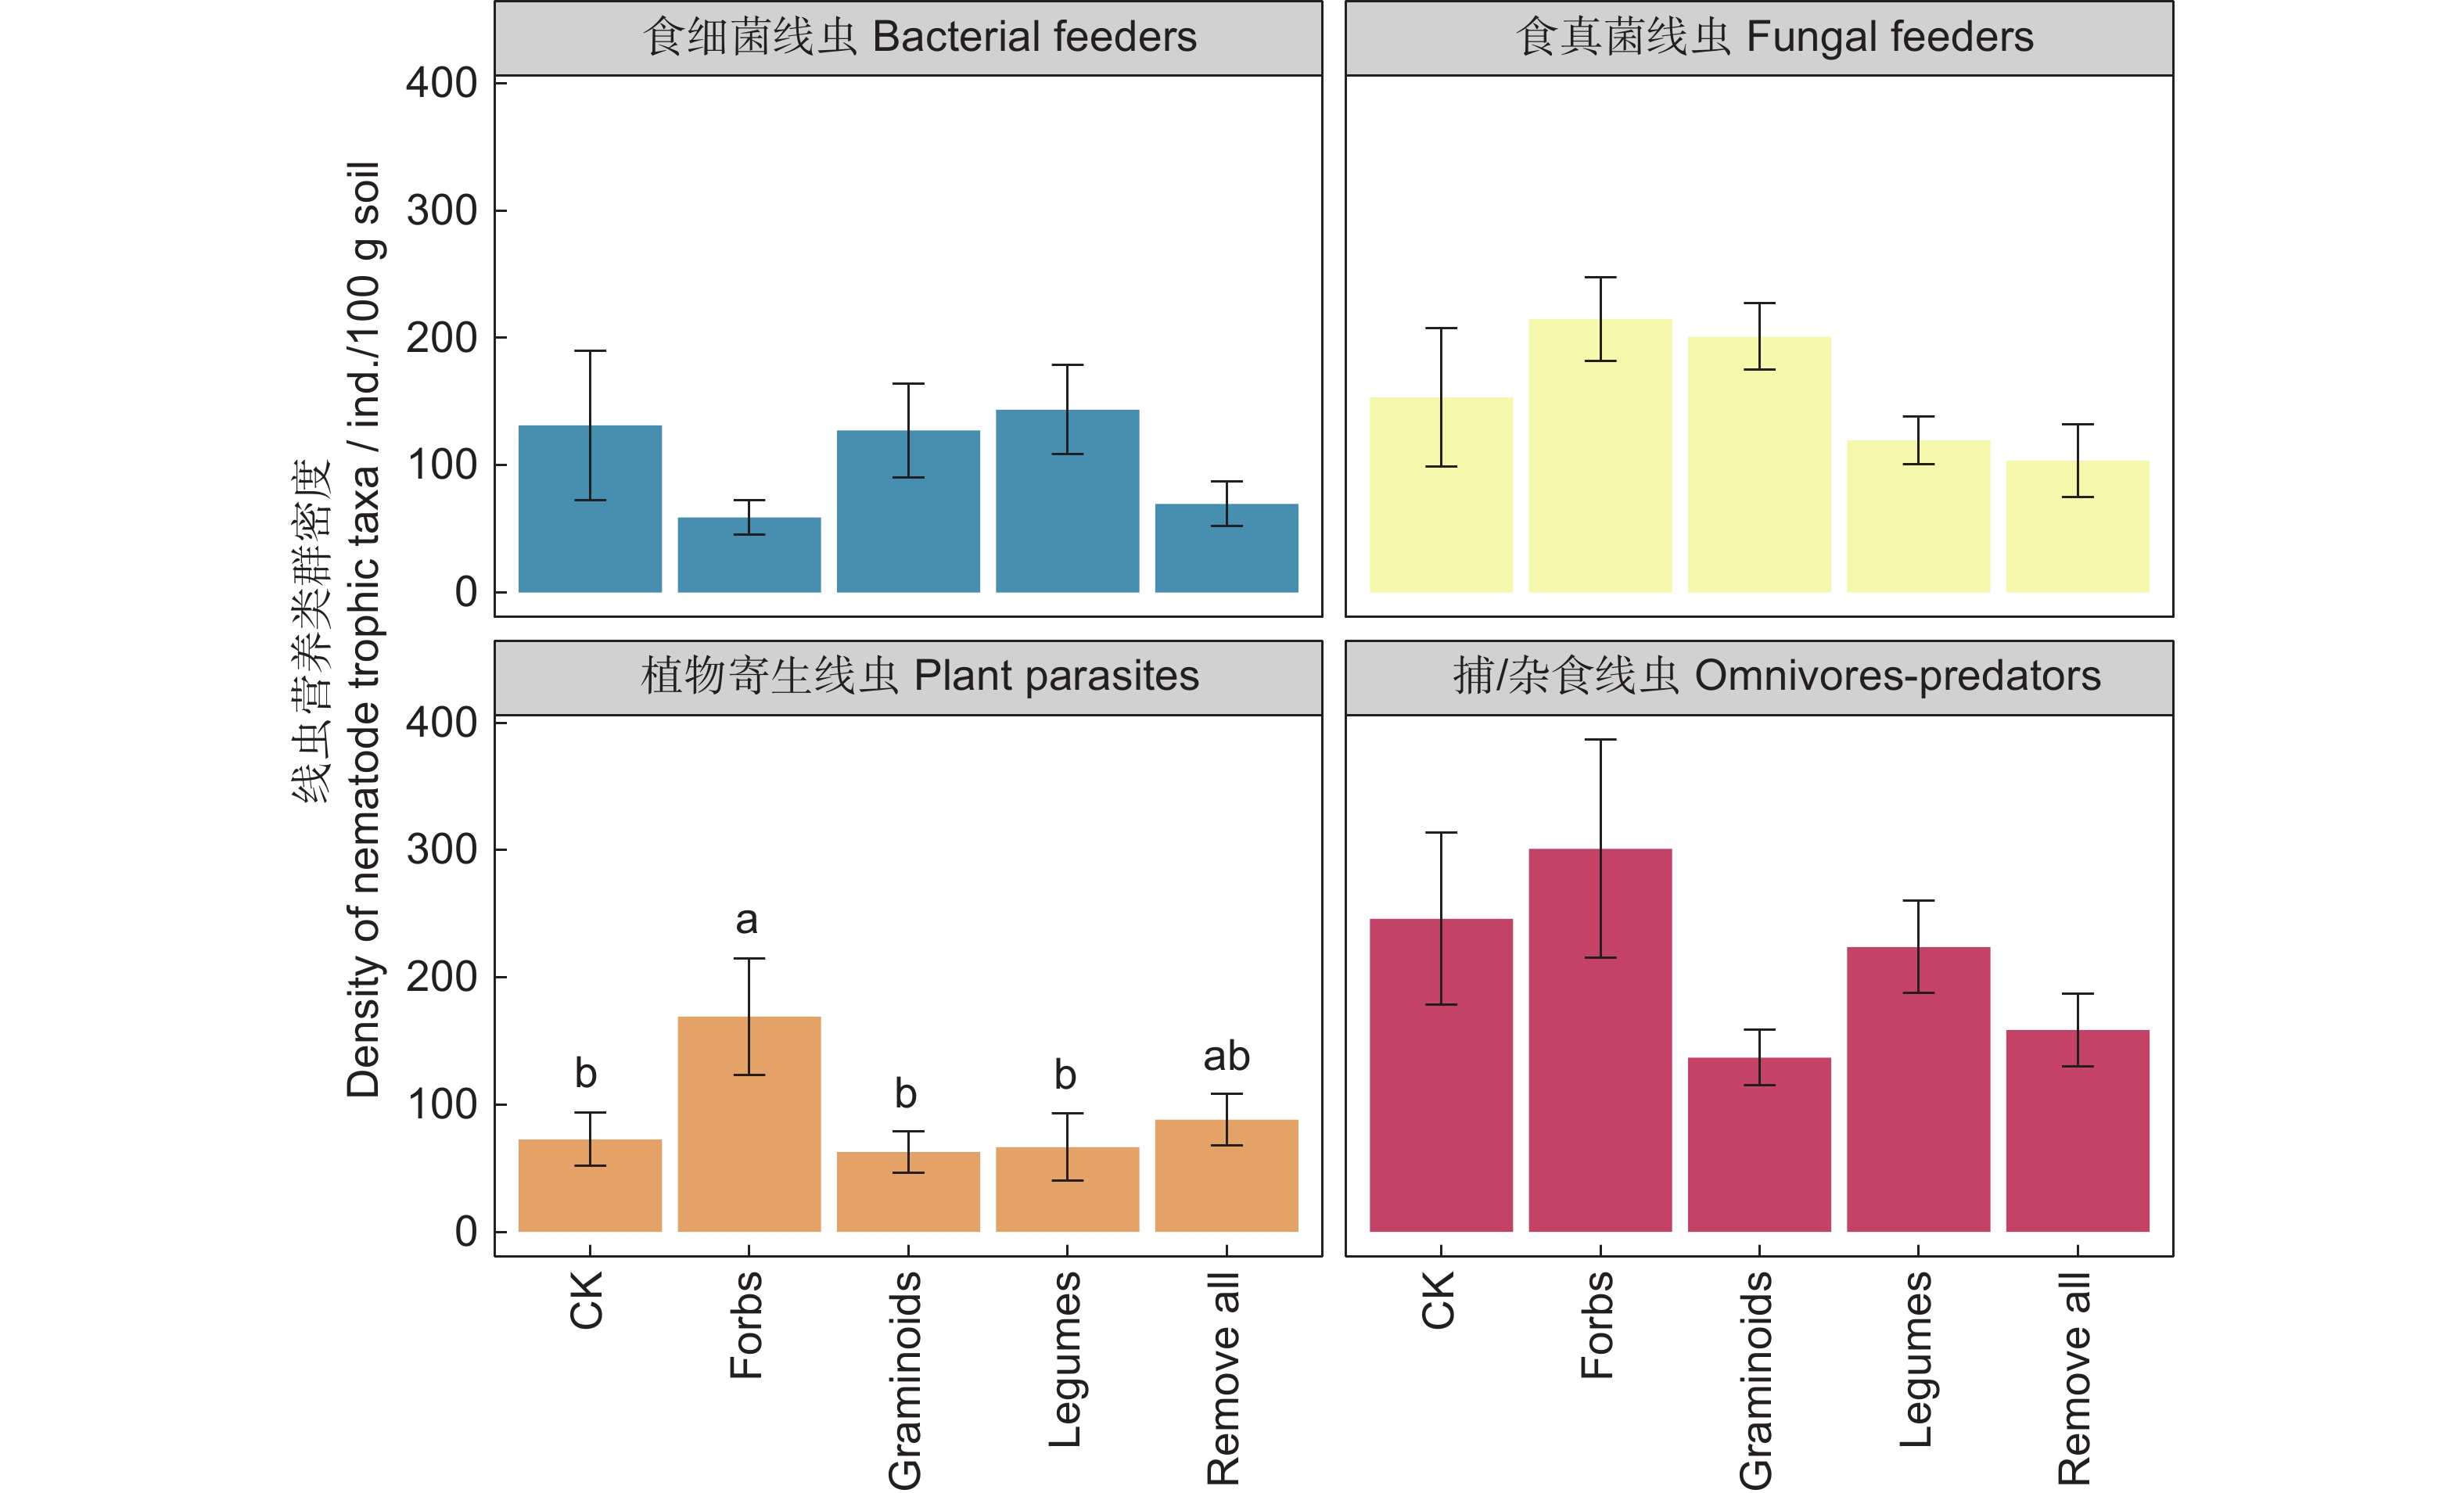
图 2 不同处理下线虫营养类群(A)和功能类群(B)的相对丰度不同小写字母表示不同处理间相同线虫营养类群的差异显著(P<0.05)。下同。Figure 2. Relative abundance of nematode trophic taxa (A) and functional groups (B) under different treatmentsDifferent lowercase letters indicate differences in same nematode trophic taxa among treatments at the 0.05 level. Same below.线虫4个营养类群中,植物寄生线虫的密度在保留杂类草处理下显著高于其他处理。食细菌线虫、食真菌线虫、捕/杂食性线虫的密度在各处理间差异不显著;在所有线虫营养类群中,捕/杂食性线虫的密度最大,食真菌线虫次之,植物寄生线虫最少(图3)。
![]() 图 3 不同处理下线虫营养类群密度Figure 3. Density of nematode trophic taxa under different treatments
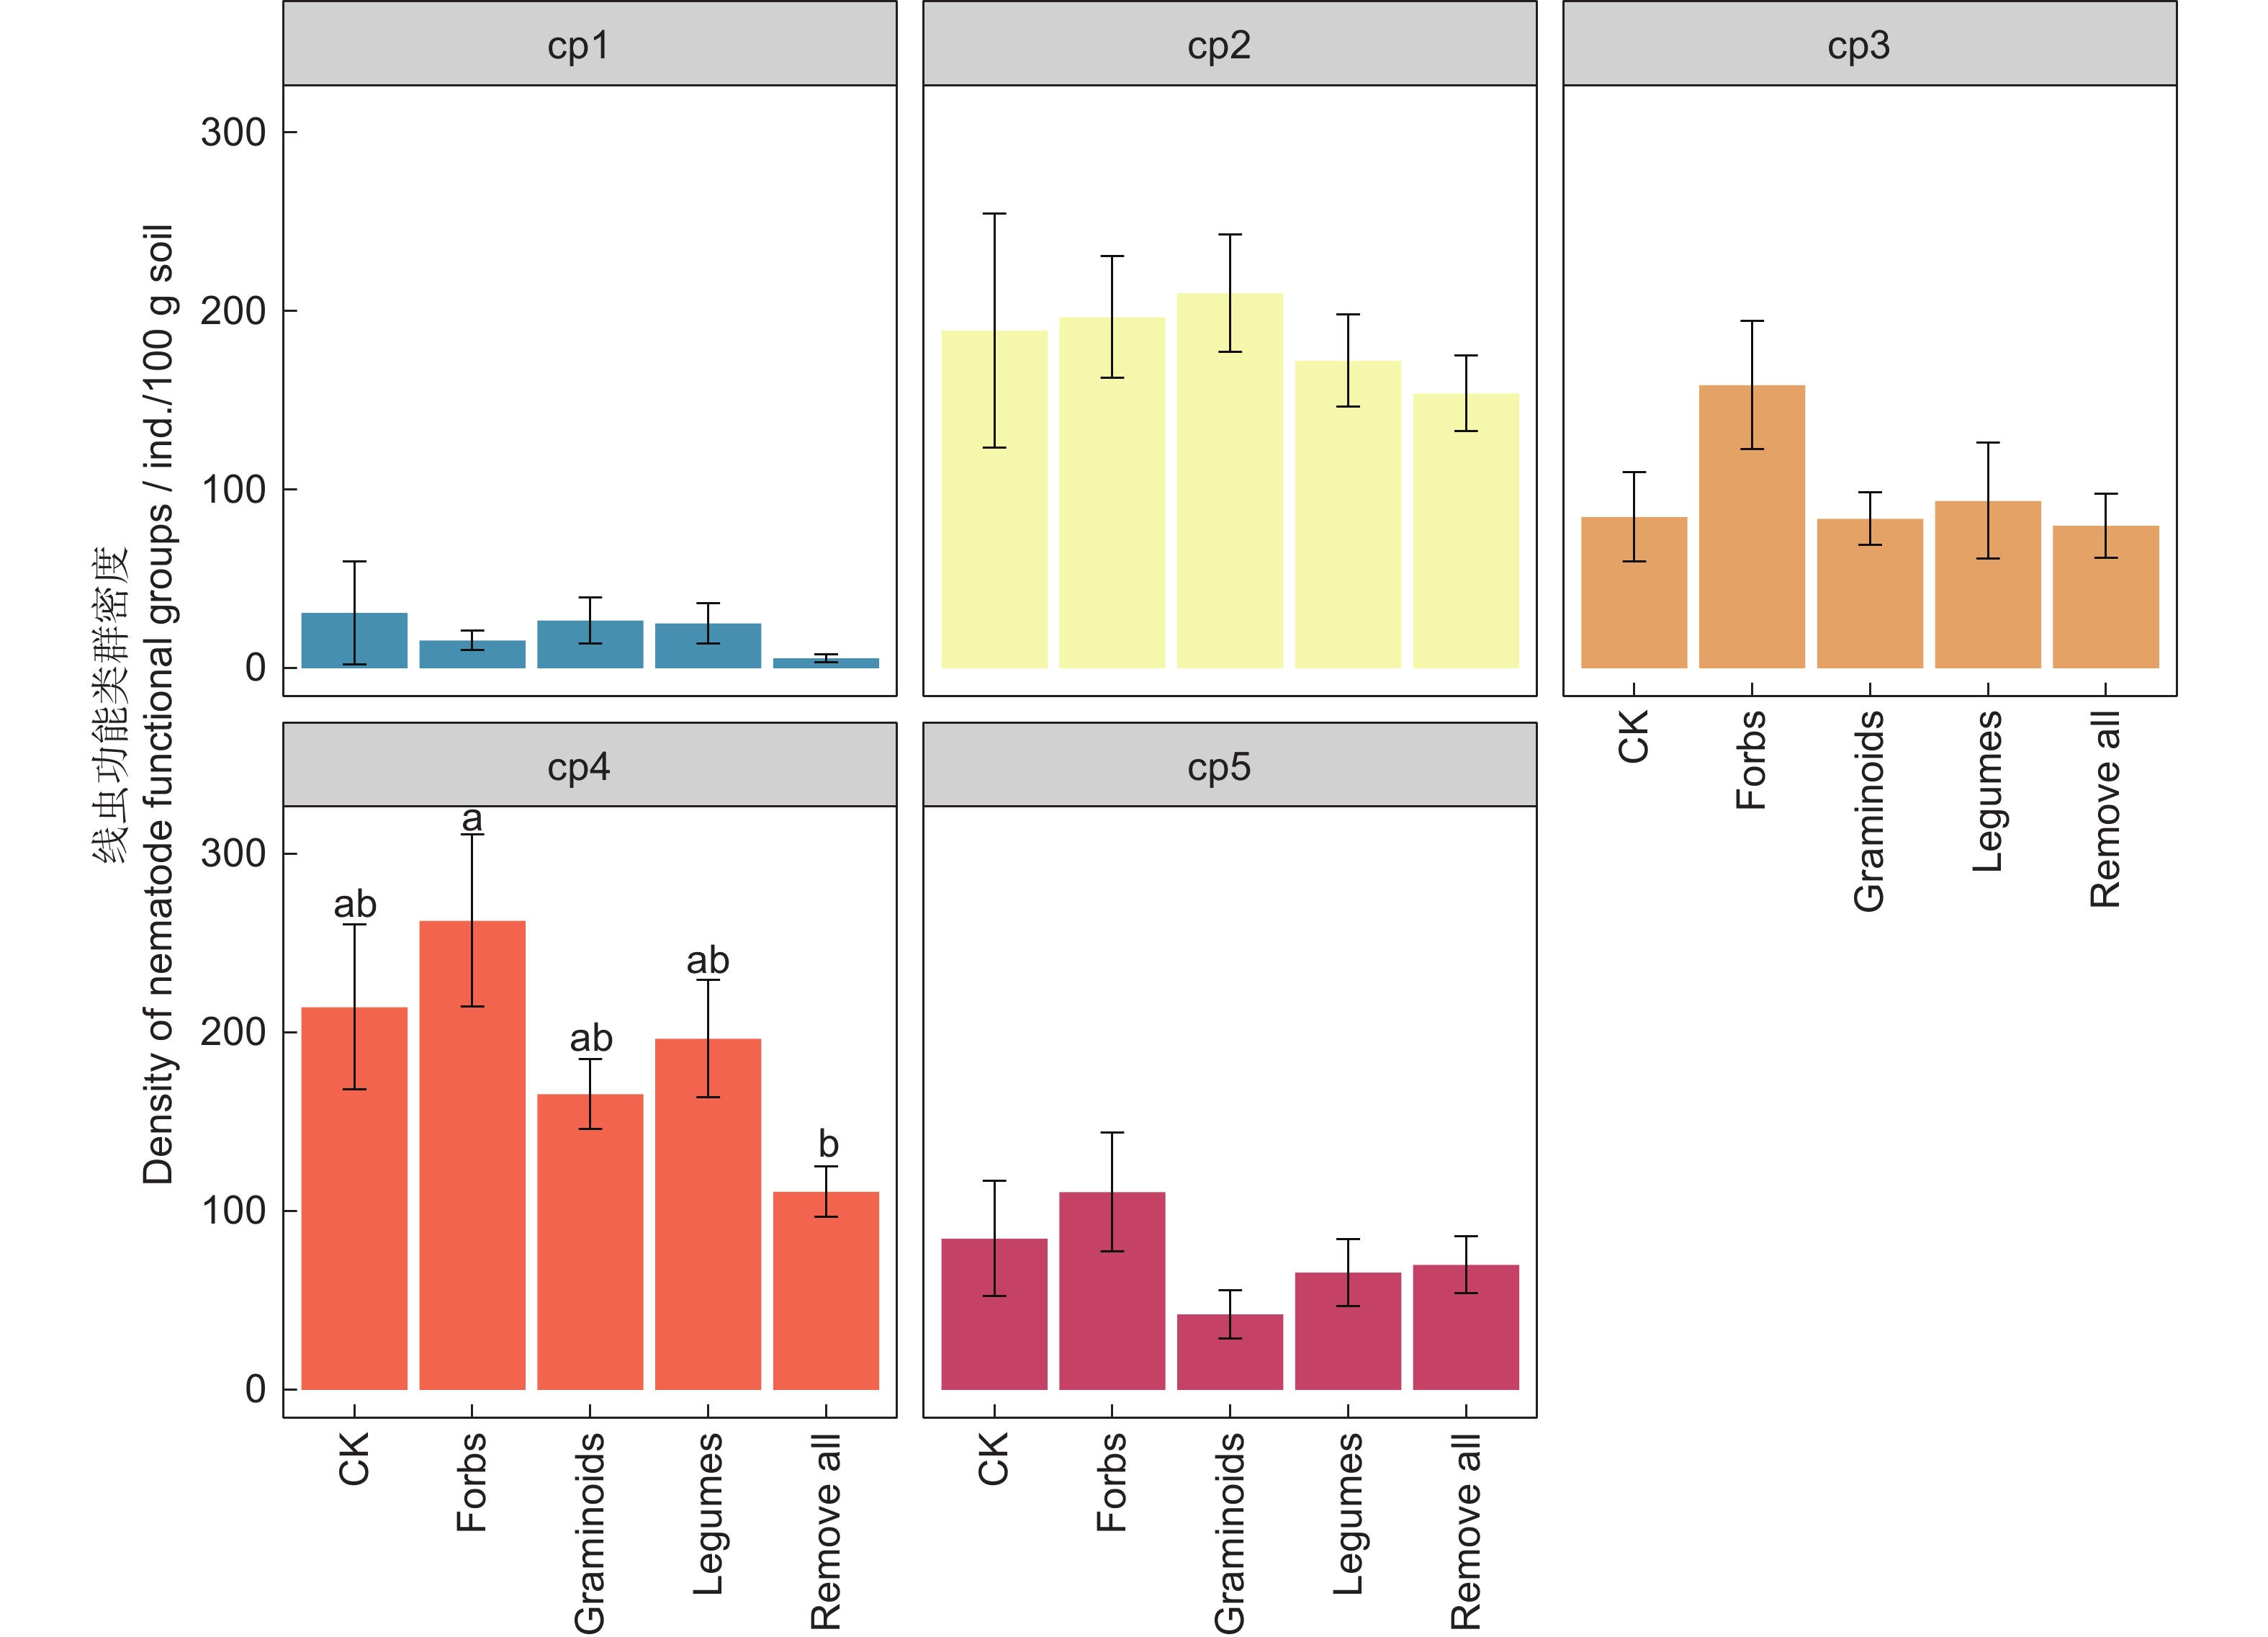
图 3 不同处理下线虫营养类群密度Figure 3. Density of nematode trophic taxa under different treatments不同植物功能去除对cp1、cp2、cp3、cp5线虫密度无显著影响,但保留杂类草处理中,cp4线虫密度显著大于去除所有植物功能群处理(图4)。在所获得的土壤线虫类群中,cp2和cp4的个体数量最多,cp1个体数量最少。
![]() 图 4 不同处理下线虫功能类群密度Figure 4. Density of nematode functional groups under different treatments
图 4 不同处理下线虫功能类群密度Figure 4. Density of nematode functional groups under different treatments2.3 土壤线虫生态指数与群落结构
不同植物功能群去除对土壤线虫群落多样性、均匀度和优势度有显著影响。香农-维纳多样性指数(H ')在保留杂类草处理中显著低于对照、保留禾状草处理以及保留豆科植物处理,而均匀度指数(J ')在保留杂类草处理中最低。保留杂类草处理下优势度指数(λ)显著大于对照、保留禾状草和豆科植物;在去除所有植物功能群处理下,λ显著大于对照。SR、NCR、EI、SI、CI等指数在不同处理间差异不显著(表2)。
表 2 不同处理下线虫各类指数Table 2. Various indices of nematodes under different treatments指数
Index对照
CK保留杂类草
Forbs保留禾状草
Graminoids保留豆科
Legumes去除所有
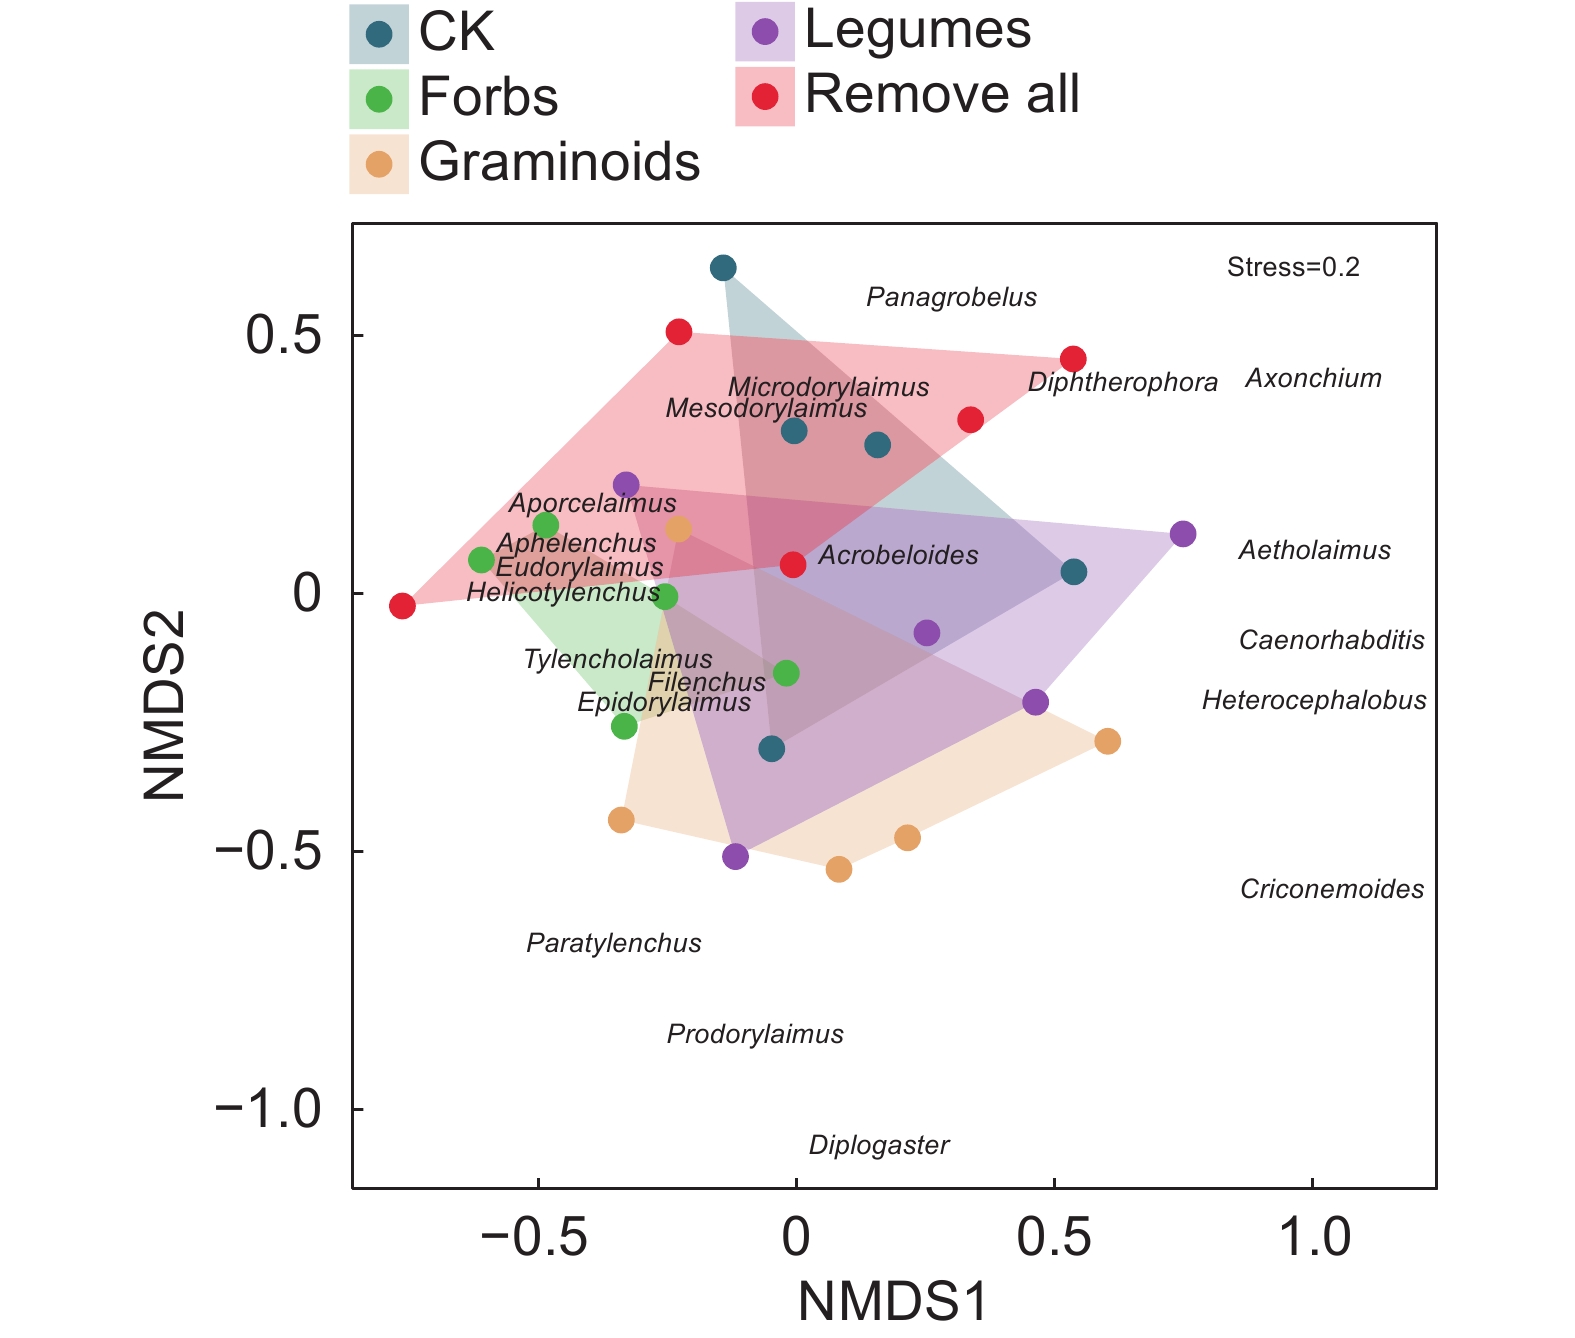
Remove allF P H' 2.69±0.11a 2.32±0.09b 2.68±0.12a 2.65±0.10a 2.42±0.14ab 2.94 0.040 2* J' 0.88±0.01a 0.82±0.01c 0.85±0.01b 0.88±0.01a 0.86±0.01ab 8.43 <0.001 0*** λ 0.08±0.01c 0.14±0.01a 0.10±0.01bc 0.09±0.01bc 0.12±0.01ab 5.06 <0.010 0** SR 4.52±0.40a 3.61±0.37a 5.06±0.58a 4.34±0.48a 3.66±0.48a 2.13 0.106 4 NCR 0.42±0.06a 0.22±0.04a 0.35±0.06a 0.51±0.08a 0.43±0.10a 2.69 0.054 6 EI 47.39±5.61a 52.22±2.22a 52.87±4.10a 50.27±3.39a 41.68±4.12a 1.59 0.207 9 SI 85.11±3.65a 86.39±2.91a 74.28±4.72a 85.83±1.30a 82.25±4.31a 2.50 0.075 0 CI 77.89±14.16a 73.08±3.91a 67.17±10.82a 61.44±13.39a 83.22±7.61a 0.81 0.531 3 注:表中数据均为平均值±标准误。H '、J '、λ、SR、NCR、EI、SI、CI分别表示香农-维纳多样性指数、均匀度指数、优势度指数、丰富度指数、线虫通路比值、富集指数、结构指数和通道指数。同行不同小写字母表示同一指标在不同处理间差异显著(P<0.05)。*: P<0.05; **: P<0.01; ***: P<0.001。下同。 Notes: All data are average values±SD. H ', J ', λ, SR, NCR, EI, SI, and CI indicate Shannon-Wiener index, Pielou evenness index, Simpson dominance index, Margalef richness index, Nematode channel ratio, Enrichment index, Structure index, and Channel index, respectively. Different lowercase letters for the same parameter in the same row indicate significant differences among different treatments at the 0.05 level. Same below. 如图5所示,植物功能群去除对土壤线虫群落结构有显著影响,膜皮属、前矛线属、异头叶属、缢咽属、针属、广杆属、双胃属、轮属、瓣唇属和Aetholaimus等稀有属导致了线虫群落结构差异;多重比较结果显示,对照与保留杂类草处理,以及保留禾状草处理与对照、保留杂类草处理、去除所有植物功能群处理之间的土壤线虫群落组成存在显著差异(表3)。
![]() 图 5 土壤线虫群落非度量多维尺度分析(NMDS)Helicotylenchus螺旋属,Filenchus丝尾垫刃属,Aporcelaimus孔咽属,Eudorylaimus真矛线属,Acrobeloides拟丽突属,Aphelenchus真滑刃属,Tylencholaimus垫咽属,Microdorylaimus微矛线属,Mesodorylaimus中矛线属,Epidorylaimus表矛线属,Diphtherophora膜皮属,Prodorylaimus前矛线属,Heterocephalobus异头叶属,Axonchium缢咽属,Paratylenchus针属,Caenorhabditis广杆属,Diplogaster双胃属,Aetholaimus (尚无中文名),Criconemoides轮属,Panagrobelus瓣唇属。Figure 5. Nonmetric multidimensional-scaling analysis (NMDS) of soil nematode communities表 3 不同处理下NMDS多重比较结果Table 3. Multiple comparison results of NMDS under different treatments
图 5 土壤线虫群落非度量多维尺度分析(NMDS)Helicotylenchus螺旋属,Filenchus丝尾垫刃属,Aporcelaimus孔咽属,Eudorylaimus真矛线属,Acrobeloides拟丽突属,Aphelenchus真滑刃属,Tylencholaimus垫咽属,Microdorylaimus微矛线属,Mesodorylaimus中矛线属,Epidorylaimus表矛线属,Diphtherophora膜皮属,Prodorylaimus前矛线属,Heterocephalobus异头叶属,Axonchium缢咽属,Paratylenchus针属,Caenorhabditis广杆属,Diplogaster双胃属,Aetholaimus (尚无中文名),Criconemoides轮属,Panagrobelus瓣唇属。Figure 5. Nonmetric multidimensional-scaling analysis (NMDS) of soil nematode communities表 3 不同处理下NMDS多重比较结果Table 3. Multiple comparison results of NMDS under different treatments处理 Treatment F P 对照-保留杂类草 1.91 0.041* 对照-保留禾状草 2.19 0.046* 对照-保留豆科 0.59 0.858 对照-去除所有 0.99 0.426 保留杂类草-保留禾状草 2.80 0.022* 保留杂类草-保留豆科 1.95 0.081 保留杂类草-去除所有 1.51 0.189 保留禾状草-保留豆科 1.53 0.107 保留禾状草-去除所有 2.62 0.006** 保留豆科-去除所有 1.30 0.208 3. 讨论
本研究经过3年时间连续去除不同的植物功能群地上部分,发现植物功能群去除对根系生物量和土壤线虫总密度没有显著影响。Gastine等[34]在探究温带草地土壤生物区系对植物多样性的响应时同样发现,植物功能群多样性对根系生物量无显著影响。其原因一方面可能是去除植物地上部分后短时间内根系的补偿生长[11],此外也有可能是青藏高原温度较低,去除地上部植物后,地下残留的根系分解慢,从而留存在土壤中造成的。而植物根系生物量是影响土壤生物群落的直接因素之一,这可能是不同植物功能群去除后土壤线虫总密度无显著差异的原因。
本研究发现,不同植物功能群去除对线虫营养类群的相对丰度有显著影响,保留豆科植物处理下食细菌线虫的相对丰度最高。这与Viketoft等[35, 36]的研究结果相一致,即豆科植物有利于食细菌线虫丰度的提高。这可能是由于豆科植物的固氮作用使植物内部和根际周围的氮浓度升高,土壤肥力增强[19],促进细菌的快速生长[37, 38],进而有利于食细菌线虫丰度的增高[39]。杨晓理[40]在青藏高原东部通过移除不同优势植物探究土壤线虫群落变化的结果表明,禾状草的存在显著增加真菌多样性。本研究中,与对照、保留豆科植物、去除所有植物功能群处理相比,保留禾状草处理显著增加了食真菌线虫的相对丰度,这可能是因为禾状草具有较高的碳氮比和叶片干物质含量,大量富含碳的根系分泌物和凋落物的输入[41],有利于真菌多样性的提高,为食真菌线虫提供了丰富的食物资源。本研究发现,除保留禾状草处理外,其他处理下捕/杂食性线虫的密度最大,可能是因为高寒草甸生态系统的生产力较高,且由于低温限制,土壤中有机质和总氮丰富[42],有利于耐受性较好、个体较大的捕/杂食性线虫的生存[43-45]。有研究表明,食物资源是食真菌线虫和食细菌线虫的重要影响因素[46]。Sun等[47]分析了高寒草甸生态系统不同退化程度对微生物群落的影响,发现在退化草地生态系统中,腐生真菌的数量最多,与细菌群落相比,真菌群落对环境变化的反应更强烈。本研究中食真菌线虫密度比食细菌线虫高,原因可能是真菌生物量较高,为前者提供了丰富的食物资源。
植物功能群去除处理对植物寄生线虫密度有显著影响,但对食细菌线虫、食真菌线虫、捕/杂食性线虫的密度影响不显著。这可能是因为植物功能群的去除,使原有植物群落地上、地下部都发生了较大变化,造成了植物寄生线虫栖息地和根系食物资源的变化,进而对其群落组成和结构产生直接或间接的影响[48]。本研究中,植物寄生线虫的相对丰度在保留杂类草处理中最高,这可能是因为杂类草具有低根组织密度和高氮含量,较高的比根长和根长密度,有利于土壤中碳的输入[49],增强了植物寄生线虫食物资源适口性和可利用性[50]。
cp1和cp2功能类群的线虫世代周期短、繁殖力强,可视为r-策略线虫,能够对外界环境变化做出快速响应[28]。本研究中,cp1和cp2功能类群的线虫在不同处理间差异不显著,在移除部分地上部植物后,土壤生态位可能被未移除植物进行了补充,从而保证了土壤生态系统功能的稳定性,使不同处理间r-策略线虫差异不明显。保留杂类草处理下的cp4线虫密度显著大于去除所有植物功能群处理,说明保留杂类草处理下的土壤环境受到的干扰和压力较小[51]。
本研究中,保留杂类草处理下线虫香农-维纳多样性指数显著小于对照,而优势度指数显著大于对照,这与Viketoft等[36]的结果一致,即青藏高原高寒草甸退化过程中,优势植物功能群由禾状草转向杂类草,线虫多样性下降,优势度增加,降低了土壤线虫群落结构的稳定性。均匀度指数在不同处理间均有显著差异,表明不同植物功能群去除显著影响不同土壤线虫类群的相对丰度。NCR和CI值均能反映土壤有机质的分解途径。在本研究中,NCR值整体小于0.5,而CI值大于50,均表明该地区高寒草甸有机质分解主要是真菌分解;同时,不同处理对两者均无显著影响,表明3年不同植物功能群的去除对土壤有机质的分解途径并没有显著影响。
利用NMDS分析土壤线虫群落结构,结果表明,不同植物功能群的去除对土壤线虫群落结构有显著影响。如,对照与保留杂类草处理土壤线虫群落组成差异明显,保留禾状草处理与对照、保留杂类草处理、去除所有植物功能群处理之间的土壤线虫群落组成差异明显。这说明不同植物功能群类别对土壤线虫群落组成的影响不一致,其中,保留杂类草和保留禾状草处理的影响较明显。对照和保留豆科植物处理的优势类群包括食真菌线虫丝尾垫刃属和捕/杂食线虫孔咽属;保留杂类草处理的优势类群包括食真菌线虫丝尾垫刃属、捕/杂食线虫孔咽属和真矛线属以及植物寄生线虫螺旋属;保留禾状草处理的优势类群包括食真菌线虫丝尾垫刃属和垫咽属;去除所有植物功能群处理的优势类群包括4个营养类群的线虫,分别为食细菌线虫拟丽突属、食真菌线虫真滑刃属、植物寄生线虫螺旋属和捕/杂食线虫孔咽属。
本研究结果表明,杂类草有利于增加植物寄生线虫的丰度;禾状草有利于增加食真菌线虫的丰度,而豆科植物有利于提高食细菌线虫丰度。杂类草的去除降低了香农-维纳多样性指数和均匀度指数,增加了优势度指数;禾状草去除降低了均匀度指数。不同植物功能群去除下,优势类群和稀有类群的改变导致了土壤线虫群落组差异。这表明植被群落的变化是影响土壤线虫群落组成和结构的重要因素之一。然而,为减少对土壤的扰动,目前植物去除实验大多选择仅对地上部分进行去除,而不对地下残留根系进行去除,在未来的研究中需要完善植物功能群去除的方法,同时区分或定量分析去除植物功能群地下部分再生长对土壤生态功能的影响。
致谢:感谢兰州大学和甘南草原生态系统国家野外科学观测研究站为采样提供的条件,感谢郭瑞博士对线虫鉴定与分析提供的指导,感谢虎灵燕和陈思涵在样地维护和植物群落测量方面提供的帮助。
-
![]()
图 1 不同处理下根系生物量(A)和线虫总密度(B)
CK表示对照,Forbs表示保留非豆科杂类草,Graminoids表示保留禾状草,Legumes表示保留豆科,Remove all表示去除所有植物功能群。下同。
Figure 1. Root biomass (A) and total density of nematodes (B) under different treatments
CK, control; Forbs, only non-legume forbs; Graminoids, only graminoids; Legumes, only legumes; Remove all, all plant functional groups removed. Same below.
![]()
图 2 不同处理下线虫营养类群(A)和功能类群(B)的相对丰度
不同小写字母表示不同处理间相同线虫营养类群的差异显著(P<0.05)。下同。
Figure 2. Relative abundance of nematode trophic taxa (A) and functional groups (B) under different treatments
Different lowercase letters indicate differences in same nematode trophic taxa among treatments at the 0.05 level. Same below.
![]()
图 3 不同处理下线虫营养类群密度
Figure 3. Density of nematode trophic taxa under different treatments
![]()
图 4 不同处理下线虫功能类群密度
Figure 4. Density of nematode functional groups under different treatments
![]()
图 5 土壤线虫群落非度量多维尺度分析(NMDS)
Helicotylenchus螺旋属,Filenchus丝尾垫刃属,Aporcelaimus孔咽属,Eudorylaimus真矛线属,Acrobeloides拟丽突属,Aphelenchus真滑刃属,Tylencholaimus垫咽属,Microdorylaimus微矛线属,Mesodorylaimus中矛线属,Epidorylaimus表矛线属,Diphtherophora膜皮属,Prodorylaimus前矛线属,Heterocephalobus异头叶属,Axonchium缢咽属,Paratylenchus针属,Caenorhabditis广杆属,Diplogaster双胃属,Aetholaimus (尚无中文名),Criconemoides轮属,Panagrobelus瓣唇属。
Figure 5. Nonmetric multidimensional-scaling analysis (NMDS) of soil nematode communities
表 1 不同处理下去除的植物功能群生物量
Table 1 Plant functional group biomass removed under different treatments
处理
Treatment杂类草
Forbs禾状草
Graminoids豆科植物
Legumes对照 − − − 保留杂类草 − 250.526±24.045a 4.482±1.010b 保留禾状草 130.184±18.125a − 3.276±1.259b 保留豆科植物 292.600±23.032a 334.168±24.688a − 去除所有 318.982±49.623a 455.814±39.827a 5.684±2.320b 注:表中数据均为平均值±标准误。每处理5个重复。同行不同小写字母表示不同功能群生物量在同一处理下差异显著(P<0.05)。 Notes: All data are average values±SD. Each treatment has five replicates. Different lowercase letters in the same row indicate significant differences in biomass of different functional groups under the same treatment at the 0.05 level.  下载: 导出CSV
表 2 不同处理下线虫各类指数
Table 2 Various indices of nematodes under different treatments
指数
Index对照
CK保留杂类草
Forbs保留禾状草
Graminoids保留豆科
Legumes去除所有
Remove allF P H' 2.69±0.11a 2.32±0.09b 2.68±0.12a 2.65±0.10a 2.42±0.14ab 2.94 0.040 2* J' 0.88±0.01a 0.82±0.01c 0.85±0.01b 0.88±0.01a 0.86±0.01ab 8.43 <0.001 0*** λ 0.08±0.01c 0.14±0.01a 0.10±0.01bc 0.09±0.01bc 0.12±0.01ab 5.06 <0.010 0** SR 4.52±0.40a 3.61±0.37a 5.06±0.58a 4.34±0.48a 3.66±0.48a 2.13 0.106 4 NCR 0.42±0.06a 0.22±0.04a 0.35±0.06a 0.51±0.08a 0.43±0.10a 2.69 0.054 6 EI 47.39±5.61a 52.22±2.22a 52.87±4.10a 50.27±3.39a 41.68±4.12a 1.59 0.207 9 SI 85.11±3.65a 86.39±2.91a 74.28±4.72a 85.83±1.30a 82.25±4.31a 2.50 0.075 0 CI 77.89±14.16a 73.08±3.91a 67.17±10.82a 61.44±13.39a 83.22±7.61a 0.81 0.531 3 注:表中数据均为平均值±标准误。H '、J '、λ、SR、NCR、EI、SI、CI分别表示香农-维纳多样性指数、均匀度指数、优势度指数、丰富度指数、线虫通路比值、富集指数、结构指数和通道指数。同行不同小写字母表示同一指标在不同处理间差异显著(P<0.05)。*: P<0.05; **: P<0.01; ***: P<0.001。下同。 Notes: All data are average values±SD. H ', J ', λ, SR, NCR, EI, SI, and CI indicate Shannon-Wiener index, Pielou evenness index, Simpson dominance index, Margalef richness index, Nematode channel ratio, Enrichment index, Structure index, and Channel index, respectively. Different lowercase letters for the same parameter in the same row indicate significant differences among different treatments at the 0.05 level. Same below.
下载: 导出CSV
表 3 不同处理下NMDS多重比较结果
Table 3 Multiple comparison results of NMDS under different treatments
处理 Treatment F P 对照-保留杂类草 1.91 0.041* 对照-保留禾状草 2.19 0.046* 对照-保留豆科 0.59 0.858 对照-去除所有 0.99 0.426 保留杂类草-保留禾状草 2.80 0.022* 保留杂类草-保留豆科 1.95 0.081 保留杂类草-去除所有 1.51 0.189 保留禾状草-保留豆科 1.53 0.107 保留禾状草-去除所有 2.62 0.006** 保留豆科-去除所有 1.30 0.208
下载: 导出CSV
-
[1] Chen H,Zhu QA,Peng CH,Wu N,Wang YF,et al. The impacts of climate change and human activities on biogeochemical cycles on the Qinghai-Tibetan Plateau[J]. Glob Change Biol,2013,19(10):2940−2955. doi: 10.1111/gcb.12277
[2] 董世魁,汤琳,张相锋,刘世梁,刘全儒,等. 高寒草地植物物种多样性与功能多样性的关系[J]. 生态学报,2017,37(5):1472−1483 Dong SK,Tang L,Zhang XF,Liu SL,Liu QR,et al. Relationship between plant species diversity and functional diversity in alpine grasslands[J]. Acta Ecologica Sinica,2017,37(5):1472−1483.
[3] 王一博,王根绪,沈永平,王彦莉. 青藏高原高寒区草地生态环境系统退化研究[J]. 冰川冻土,2005,27(5):633−640 Wang YB,Wang GX,Shen YP,Wang YL. Degradation of the eco-environmental system in alpine meadow on the Tibetan Plateau[J]. Journal of Glaciology and Geocryology,2005,27(5):633−640.
[4] Shao QQ,Cao W,Fan JW,Huang L,Xu XL. Effects of an ecological conservation and restoration project in the Three-River Source Region,China[J]. J Geogr Sci,2017,27(2):183−204. doi: 10.1007/s11442-017-1371-y
[5] Loreau M,Naeem S,Inchausti P,Bengtsson J,Grime JP,et al. Biodiversity and ecosystem functioning:current knowledge and future challenges[J]. Science,2001,294(5543):804−808. doi: 10.1126/science.1064088
[6] Wang P,Guo J,Xu XY,Yan XB,Zhang KC,et al. Soil acidification alters root morphology,increases root biomass but reduces root decomposition in an alpine grassland[J]. Environ Pollut,2020,265:115016. doi: 10.1016/j.envpol.2020.115016
[7] 侯扶江,杨中艺. 放牧对草地的作用[J]. 生态学报,2006,26(1):244−264 Hou FJ,Yang ZY. Effects of grazing of livestock on grassland[J]. Acta Ecologica Sinica,2006,26(1):244−264.
[8] Li W,Wen SJ,Hu WX,Du GZ. Root-shoot competition interactions cause diversity loss after fertilization:a field experiment in an alpine meadow on the Tibetan Plateau[J]. J Plant Ecol,2011,4(3):138−146. doi: 10.1093/jpe/rtq031
[9] Wu GL,Du GZ,Liu ZH,Thirgood S. Effect of fencing and grazing on a Kobresia-dominated meadow in the Qinghai-Tibetan Plateau[J]. Plant Soil,2009,319(1-2):115−126. doi: 10.1007/s11104-008-9854-3
[10] Gou XM,Reich PB,Qiu LP,Shao MA,Wei GH,et al. Leguminous plants significantly increase soil nitrogen cycling across global climates and ecosystem types[J]. Glob Change Biol,2023,29(14):4028−4043. doi: 10.1111/gcb.16742
[11] Chen WJ,Zhou HK,Wu Y,Wang J,Zhao ZW,et al. Loss of plant functional groups impacts soil carbon flow by changing multitrophic interactions within soil micro-food webs[J]. Appl Soil Ecol,2022,178:104566. doi: 10.1016/j.apsoil.2022.104566
[12] Yeates GW,Bongers T,de Goede RGM,Freckman DW,Georgieva SS. Feeding habits in soil nematode families and genera-an outline for soil ecologists[J]. J Nematol,1993,25(3):315−331.
[13] 吴雨薇,罗珊,拉琼,吴纪华. 青藏高原三江源区不同恢复期高寒草甸土壤线虫群落演变[J]. 土壤,2022,54(3):532−538 Wu YW,Luo S,La Q,Wu JH. Response of soil nematode communities to restoration of alpine meadow grassland in three-river headwater region on Qinghai-Tibet Plateau in different restoration periods[J]. Soils,2022,54(3):532−538.
[14] Jiang YJ,Qian HY,Wang XY,Chen LJ,Liu MQ,et al. Nematodes and microbial community affect the sizes and turnover rates of organic carbon pools in soil aggregates[J]. Soil Biol Biochem,2018,119:22−31. doi: 10.1016/j.soilbio.2018.01.001
[15] 马金豪,栾军伟,王晖,叶晓丹,王一,等. 乔木根系和凋落物对南亚热带3种人工林土壤线虫群落的差异化影响[J]. 生态学报,2023,43(18):7367−7380 Ma JH,Luan JW,Wang H,Ye XD,Wang Y,et al. Differential impacts of tree root and litter on soil nematode communities in three artificial stands in subtropical South China[J]. Acta Ecologica Sinica,2023,43(18):7367−7380.
[16] Altieri MA. The ecological role of biodiversity in agroecosystems[J]. Agric Ecosyst Environ,1999,74(1-3):19−31. doi: 10.1016/S0167-8809(99)00028-6
[17] 刘艳方,王文颖,索南吉,周华坤,毛旭锋,等. 青海海北植物群落类型与土壤线虫群落相互关系[J]. 植物生态学报,2022,46(1):27−39 doi: 10.17521/cjpe.2020.0406 Liu YF,Wang WY,Suo NJ,Zhou HK,Mao XF,et al. Relationship between plant community types and soil nematode communities in Haibei,Qinghai,China[J]. Chinese Journal of Plant Ecology,2022,46(1):27−39. doi: 10.17521/cjpe.2020.0406
[18] Viketoft M. Effects of six grassland plant species on soil nematodes:a glasshouse experiment[J]. Soil Biol Biochem,2008,40(4):906−915. doi: 10.1016/j.soilbio.2007.11.006
[19] Ye YY,Rui YC,Zeng ZX,He XY,Wang KL,Zhao J. Responses of soil nematode community to monoculture or mixed culture of a grass and a legume forage species in China[J]. Pedosphere,2020,30(6):791−800. doi: 10.1016/S1002-0160(20)60039-X
[20] 姬阳光. 降水改变、施氮和增温对青藏高原高寒草甸植物群落结构的影响[D]. 南京:南京农业大学,2017:9. [21] Li WJ,Luo S,Wang JF,Zheng XY,Zhou X,et al. Nitrogen deposition magnifies destabilizing effects of plant functional group loss[J]. Sci Total Environ,2022,835:155419. doi: 10.1016/j.scitotenv.2022.155419
[22] Wang SP,Duan JC,Xu GP,Wang YF,Zhang ZH,et al. Effects of warming and grazing on soil N availability,species composition,and ANPP in an alpine meadow[J]. Ecology,2012,93(11):2365−2376. doi: 10.1890/11-1408.1
[23] Liu MQ,Chen XY,Qin JT,Wang D,Griffiths B,Hu F. A sequential extraction procedure reveals that water management affects soil nematode communities in paddy fields[J]. Appl Soil Ecol,2008,40(2):250−259. doi: 10.1016/j.apsoil.2008.05.001
[24] Bongers T. The maturity index:an ecological measure of environmental disturbance based on nematode species composition[J]. Oecologia,1990,83(1):14−19. doi: 10.1007/BF00324627
[25] Bongers T. De Nematoden Van Nederland:Een Identificatietabel Voor de in Nederland Aangetroffen Zoetwater-En Bodembewonende Nematoden[M]. The Netherlands:Stichting Uitgeverij Koninklijke Nederlandse Natuurhistorische Vereniging,1988:52−408.
[26] Yeates GW,Bongers T. Nematode diversity in agroecosystems[J]. Agric Ecosyst Environ,1999,74(1-3):113−135. doi: 10.1016/S0167-8809(99)00033-X
[27] Yeates GW. Nematodes as soil indicators:functional and biodiversity aspects[J]. Biol Fertil Soils,2003,37(4):199−210. doi: 10.1007/s00374-003-0586-5
[28] Ferris H,Bongers T,de Goede RGM. A framework for soil food web diagnostics:extension of the nematode faunal analysis concept[J]. Appl Soil Ecol,2001,18(1):13−29. doi: 10.1016/S0929-1393(01)00152-4
[29] Kuznetsova A,Brockhoff PB,Christensen RHB. lmerTest package:tests in linear mixed effects models[J]. J Stat Softw,2017,82(13):1−26.
[30] R Core Team. The R project for statistical computing[EB/OL]. Vienna,Austria. 2022. https://www.R-project.org/.
[31] Hothorn T,Bretz F,Westfall P. Simultaneous inference in general parametric models[J]. Biom J,2008,50(3):346−363. doi: 10.1002/bimj.200810425
[32] Dixon P. Vegan,a package of R functions for community ecology[J]. J Veg Sci,2003,14(6):927−930. doi: 10.1111/j.1654-1103.2003.tb02228.x
[33] Ginestet C. ggplot2:Elegant graphics for data analysis[J]. J Roy Stat Soc Ser A Stat Soc,2011,174(1):245−246. doi: 10.1111/j.1467-985X.2010.00676_9.x
[34] Gastine A,Scherer-Lorenzen M,Leadley PW. No consistent effects of plant diversity on root biomass,soil biota and soil abiotic conditions in temperate grassland communities[J]. Appl Soil Ecol,2003,24(1):101−111. doi: 10.1016/S0929-1393(02)00137-3
[35] Viketoft M,Palmborg C,Sohlenius B,Huss-Danell K,Bengtsson J. Plant species effects on soil nematode communities in experimental grasslands[J]. Appl Soil Ecol,2005,30(2):90−103. doi: 10.1016/j.apsoil.2005.02.007
[36] Viketoft M,Bengtsson J,Sohlenius B,Berg MP,Petchey O,et al. Long-term effects of plant diversity and composition on soil nematode communities in model grasslands[J]. Ecology,2009,90(1):90−99. doi: 10.1890/08-0382.1
[37] Stephan A,Meyer AH,Schmid B. Plant diversity affects culturable soil bacteria in experimental grassland communities[J]. J Ecol,2000,88(6):988−998. doi: 10.1046/j.1365-2745.2000.00510.x
[38] Zhao J,Zeng ZX,He XY,Chen HS,Wang KL. Effects of monoculture and mixed culture of grass and legume forage species on soil microbial community structure under different levels of nitrogen fertilization[J]. Eur J Soil Biol,2015,68:61−68. doi: 10.1016/j.ejsobi.2015.03.008
[39] Scherer-Lorenzen M,Palmborg C,Prinz A,Schulze ED. The role of plant diversity and composition for nitrate leaching in grasslands[J]. Ecology,2003,84(6):1539−1552. doi: 10.1890/0012-9658(2003)084[1539:TROPDA]2.0.CO;2
[40] 杨晓理. 高寒草甸不同优势植物对土壤线虫群落的直接和间接作用及其机制[D]. 兰州:兰州大学,2019:19−21. [41] Kaiser C,Kilburn MR,Clode PL,Fuchslueger L,Koranda M,et al. Exploring the transfer of recent plant photosynthates to soil microbes:mycorrhizal pathway vs direct root exudation[J]. New Phytol,2015,205(4):1537−1551. doi: 10.1111/nph.13138
[42] Wang YT,Niu KC. Effect of soil environment on functional diversity of soil nematodes in Tibetan alpine meadows[J]. Biodiv Sci,2020,28(6):707−717. doi: 10.17520/biods.2020042
[43] Andriuzzi WS,Wall DH. Grazing and resource availability control soil nematode body size and abundance-mass relationship in semi-arid grassland[J]. J Anim Ecol,2018,87(5):1407−1417. doi: 10.1111/1365-2656.12858
[44] Liu T,Guo R,Ran W,Whalen JK,Li HX. Body size is a sensitive trait-based indicator of soil nematode community response to fertilization in rice and wheat agroecosystems[J]. Soil Biol Biochem,2015,88:275−281. doi: 10.1016/j.soilbio.2015.05.027
[45] Van den Hoogen J,Geisen S,Routh D,Ferris H,Traunspurger W,et al. Soil nematode abundance and functional group composition at a global scale[J]. Nature,2019,572(7768):194−198. doi: 10.1038/s41586-019-1418-6
[46] Fanin N,Kardol P,Farrell M,Kempel A,Ciobanu M,et al. Effects of plant functional group removal on structure and function of soil communities across contrasting ecosystems[J]. Ecol Lett,2019,22(7):1095−1103. doi: 10.1111/ele.13266
[47] Sun JJ,Wang PB,Wang HB,Yu XJ. Changes in plant communities,soil characteristics,and microbial communities in alpine meadows degraded to different degrees by pika on the Qinghai-Tibetan Plateau[J]. Glob Ecol and Conserv,2021,27:e01621.
[48] 杨锐,吴鹏飞,魏雪. 天然高寒草地转变为燕麦人工草地对土壤线虫群落的影响[J]. 生态学报,2020,40(14):4903−4920 Yang R,Wu PF,Wei X. Effects of the transformation from natural alpine grassland to artificial oat grassland on the soil nematode communities[J]. Acta Ecologica Sinica,2020,40(14):4903−4920.
[49] De Deyn GB,Raaijmakers CE,van Ruijven J,Berendse F,van der Putten WH. Plant species identity and diversity effects on different trophic levels of nematodes in the soil food web[J]. Oikos,2004,106(3):576−586. doi: 10.1111/j.0030-1299.2004.13265.x
[50] Zhang CZ,Wang JJ,Ren ZH,Hu ZK,Tian SY,et al. Root traits mediate functional guilds of soil nematodes in an ex-arable field[J]. Soil Biol Biochem,2020,151:108038. doi: 10.1016/j.soilbio.2020.108038
[51] Gupta D,Bhandari S,Bhusal DR. Variation of nematode indices under contrasting pest management practices in a tomato growing agro-ecosystem[J]. Heliyon,2019,5(10):e02621. doi: 10.1016/j.heliyon.2019.e02621
-
期刊类型引用(1)
1. 吴子龙,张晨,刘天艺,纪佳佳,刘瑶瑶,任梦莹,赵昕. 外源水杨酸对PEG胁迫下谷子发芽及幼苗生长的影响. 饲料研究. 2024(06): 115-119 .  百度学术
百度学术
其他类型引用(1)


计量
- 文章访问数: 216
- HTML全文浏览量: 53
- PDF下载量: 24
- 被引次数: 2
