
Responses of invasive alien plant Erigeron canadensis L. to nutrient availability and fluctuations
-
摘要:
全球变化不仅会造成环境中资源的稳态变化,还会引起资源的波动性变化。资源变化影响外来植物的成功入侵,但是资源的波动性变化对入侵植物地上、地下生物量分配模式的影响仍不清楚。本研究以入侵植物小蓬草(Erigeron canadensis L.)为研究对象,设置了4种不同的营养添加方式(恒定低、恒定高、多个小脉冲和单个大脉冲)探究外来入侵植物如何响应环境中资源的波动性变化。结果显示:(1)相比于低营养条件,高营养条件显著提高小蓬草的地上、地下生物量、叶绿素含量以及比叶面积,但是根冠比却表现出显著的下降趋势;(2)在所有的高营养处理中,营养脉冲也会影响小蓬草的生物量、根冠比和比叶面积;(3)单个大脉冲会显著抑制小蓬草的地上生物量,促进地下生物量;(4)多个小脉冲对小蓬草的总生物量有一定的促进作用,并显著增加了比叶面积。研究结果说明,环境中资源波动的变化形式会改变入侵植物的地上-地下生长策略从而影响其生长特征,但是资源的波动性变化并没有显著促进外来入侵植物的生长。
Abstract:Global change will not only affect environmental conditions but also temporal environmental fluctuations. Fluctuations in resources contribute to the successful invasion of alien plant species; however, the impact of resource fluctuations on the biomass allocation to aboveground and belowground parts of invasive plants remains largely unclear. Using the invasive plant Erigeron canadensis L. as a target species, we established four different nutrient additions (constant low, constant high, multiple pulses, and single pulse) to investigate how invasive alien plants respond to changes in resource availability in the environment. Results showed that aboveground biomass, belowground biomass, chlorophyll content, and specific leaf area of E. canadensis were significantly increased under high nutrient conditions compared to low nutrient conditions, although the root-shoot ratio decreased significantly. In all high nutrient treatments, the temporal pattern of nutrient supply also affected plant biomass production, root-shoot ratio, and specific leaf area. Particularly, single pulse treatment greatly inhibited aboveground biomass and promoted belowground biomass, while multiple pulse treatment exhibited a slight tendency to promote total biomass of the invasive plants and significantly increase specific leaf area. Our study shows that environmental resource fluctuation can change the growth strategy of invasive plants and thus affect their performance, but nutrient availability fluctuations do not significantly promote the growth of invasive plants.
-
随着全球化进程的不断加深,越来越多的外来植物跨越了地理屏障进入到新的区域形成入侵[1-5]。外来入侵植物极大地威胁着世界范围内的物种分布、生物群落多样性和生态系统的稳定性。因此,阐明外来植物成功入侵的驱动因素对理解入侵机制,制定管控措施至关重要[6-9]。
土壤养分可用性的增加是驱动外来植物入侵的重要因素[10-12]。研究表明,成功入侵的外来植物通常会比本地植物对营养增加的反应更为强烈[13],然而,极端天气事件(如干旱、洪水、火灾等)频发,造成土壤养分以非稳态的形式变化[14-17],导致可利用的营养成分可能以一个或多个不同幅度的脉冲形式呈现,并可能表现出缓慢或快速积累的变化情况[11]。但已有研究往往集中在营养水平的平均变化对外来入侵植物的影响[13, 14],对于外来入侵植物如何响应环境中营养的波动性变化还知之甚少。
资源波动假说认为,营养随时间的波动变化往往致使群落会更容易被外来植物成功入侵[11, 18]。在营养供应总量一致的情况下,许多学者通过控制营养在实验周期内的变化频率,揭示了入侵植物从营养波动中比从持续的营养供应中获益更多[19-21]。例如,Liu等[19]的研究发现,单个大脉冲形式添加的营养会比恒定速率添加的营养更能促进入侵植物的生长。Parepa等[20]的研究发现,以单个大脉冲或多个小脉冲形式添加的营养显著提高了入侵植物日本虎杖(Fallopia japonica (Houtt.) Ronse Decr.)在群落中的生物量占比。虽然,以往研究强调了入侵植物整体对资源波动的响应,但是仍不清楚资源波动如何调节入侵植物地上、地下生物量分配。
小蓬草(Erigeron canadensis L.)是菊科一年生草本植物,原产于北美,现已成为全球温带和亚热带地区的主要入侵植物[22, 23]。作为一种入侵性杂草,小蓬草适宜在草坪、路边荒地等生境中生长,并形成单一优势群落,具有较强的竞争优势,对当地的物种多样性以及生态系统结构和功能都产生了严重的影响[23]。小蓬草的成功入侵通常会归因于几个内在的生物特征,例如较高的种子产量、有效的种子传播、强的适应能力、化感效应、高遗传多样性等[24-27]。然而,资源波动等非生物因素如何影响小蓬草的入侵在很大程度上是未知的。
基于此,本研究探究小蓬草对营养波动的响应,特别是地上、地下的资源分配策略,以期揭示非生物因素对小蓬草生长的影响。我们通过盆栽控制实验比较小蓬草的地上、地下生物量生产、叶绿素以及比叶面积对营养添加和波动的可塑性响应,旨在回答以下科学问题:(1)小蓬草的地上、地下生物量是否能显著受益于营养水平的提高?(2)营养波动是否能改变小蓬草的地上、地下生物量分配策略?
1. 材料与方法
1.1 研究体系
小蓬草于1860年在山东烟台发现,现在中国南北各省均有分布[28],是武汉(29°97'~31°36'N,113°68'~115°08'E)地区农田和受扰动区域的主要入侵者[29]。本研究所用的种子均采自湖北省武汉市。
1.2 温室实验设计
于2021年3-7月,在中国科学院武汉植物园(30.51°N,114.54°E)开展温室实验的研究。将小蓬草的种子播种在装满营养土的托盘(16 × 8 × 4.5 cm)中。经过1 ~ 2周的生长,选取了大小相似的幼苗(植株高度约为5 cm)移栽到装有混合基质的2.5 L圆形花盆中,混合基质由河沙和蛭石按照1 : 1的比例混合均匀而成。为了模拟该物种的种群生长,每盆中种植4株幼苗。选择种植盆的容积,既满足植物生长必需的空间,又可确保植物能够经历不同程度的竞争。在移植这些幼苗一周后,开始施加不同的营养处理。本实验使用Hoagland溶液(硝酸钙945 mg/L、硝酸钾607 mg/L、磷酸二氢铵115 mg/L、七水硫酸镁493 mg/L、铁盐2.5 mg/L、硼酸2.86 mg/L、硫酸锰2.13 mg/L、硫酸锌0.22 mg/L、硫酸铜0.08 mg/L及钼酸铵0.02 mg/L)作为营养液,在生长周期过程中每周施用一次,总共施用10周。为了研究不同的养分供应和养分供应的时间模式对入侵植物小蓬草的影响,我们设置4种营养添加处理:(1)恒定低;(2)恒定高;(3)多个小脉冲;(4)单个大脉冲。(1)低营养:在整个实验周期添加100 mL浓度为400%的Hoagland溶液。(2) ~ (4)均为高营养处理,在整个实验过程中均添加400 mL浓度为400%的Hoagland溶液,但营养供给的频率不同(图1)。为避免处理(1) ~ (4)的供水差异而造成的潜在偏差,向每个盆中添加额外的水,使总溶液体积为250 mL。对于每一个营养处理,各设置了30个重复,实验总计120盆。所有盆被随机分配到温室架子上的位置,同时在实验期间每隔3周再次重新随机分配。在每个盆底下放置了一个塑料托盘以避免水和营养液的泄漏,从而避免水和营养供应时的实验误差。温室的温度保持在22 ℃ ~ 28 ℃,昼夜时间设置为14 h/10 h。为确保水不会限制植物生长,在实验期间每天检查所有盆栽。当土壤干燥时,为所有花盆添加等量的水。
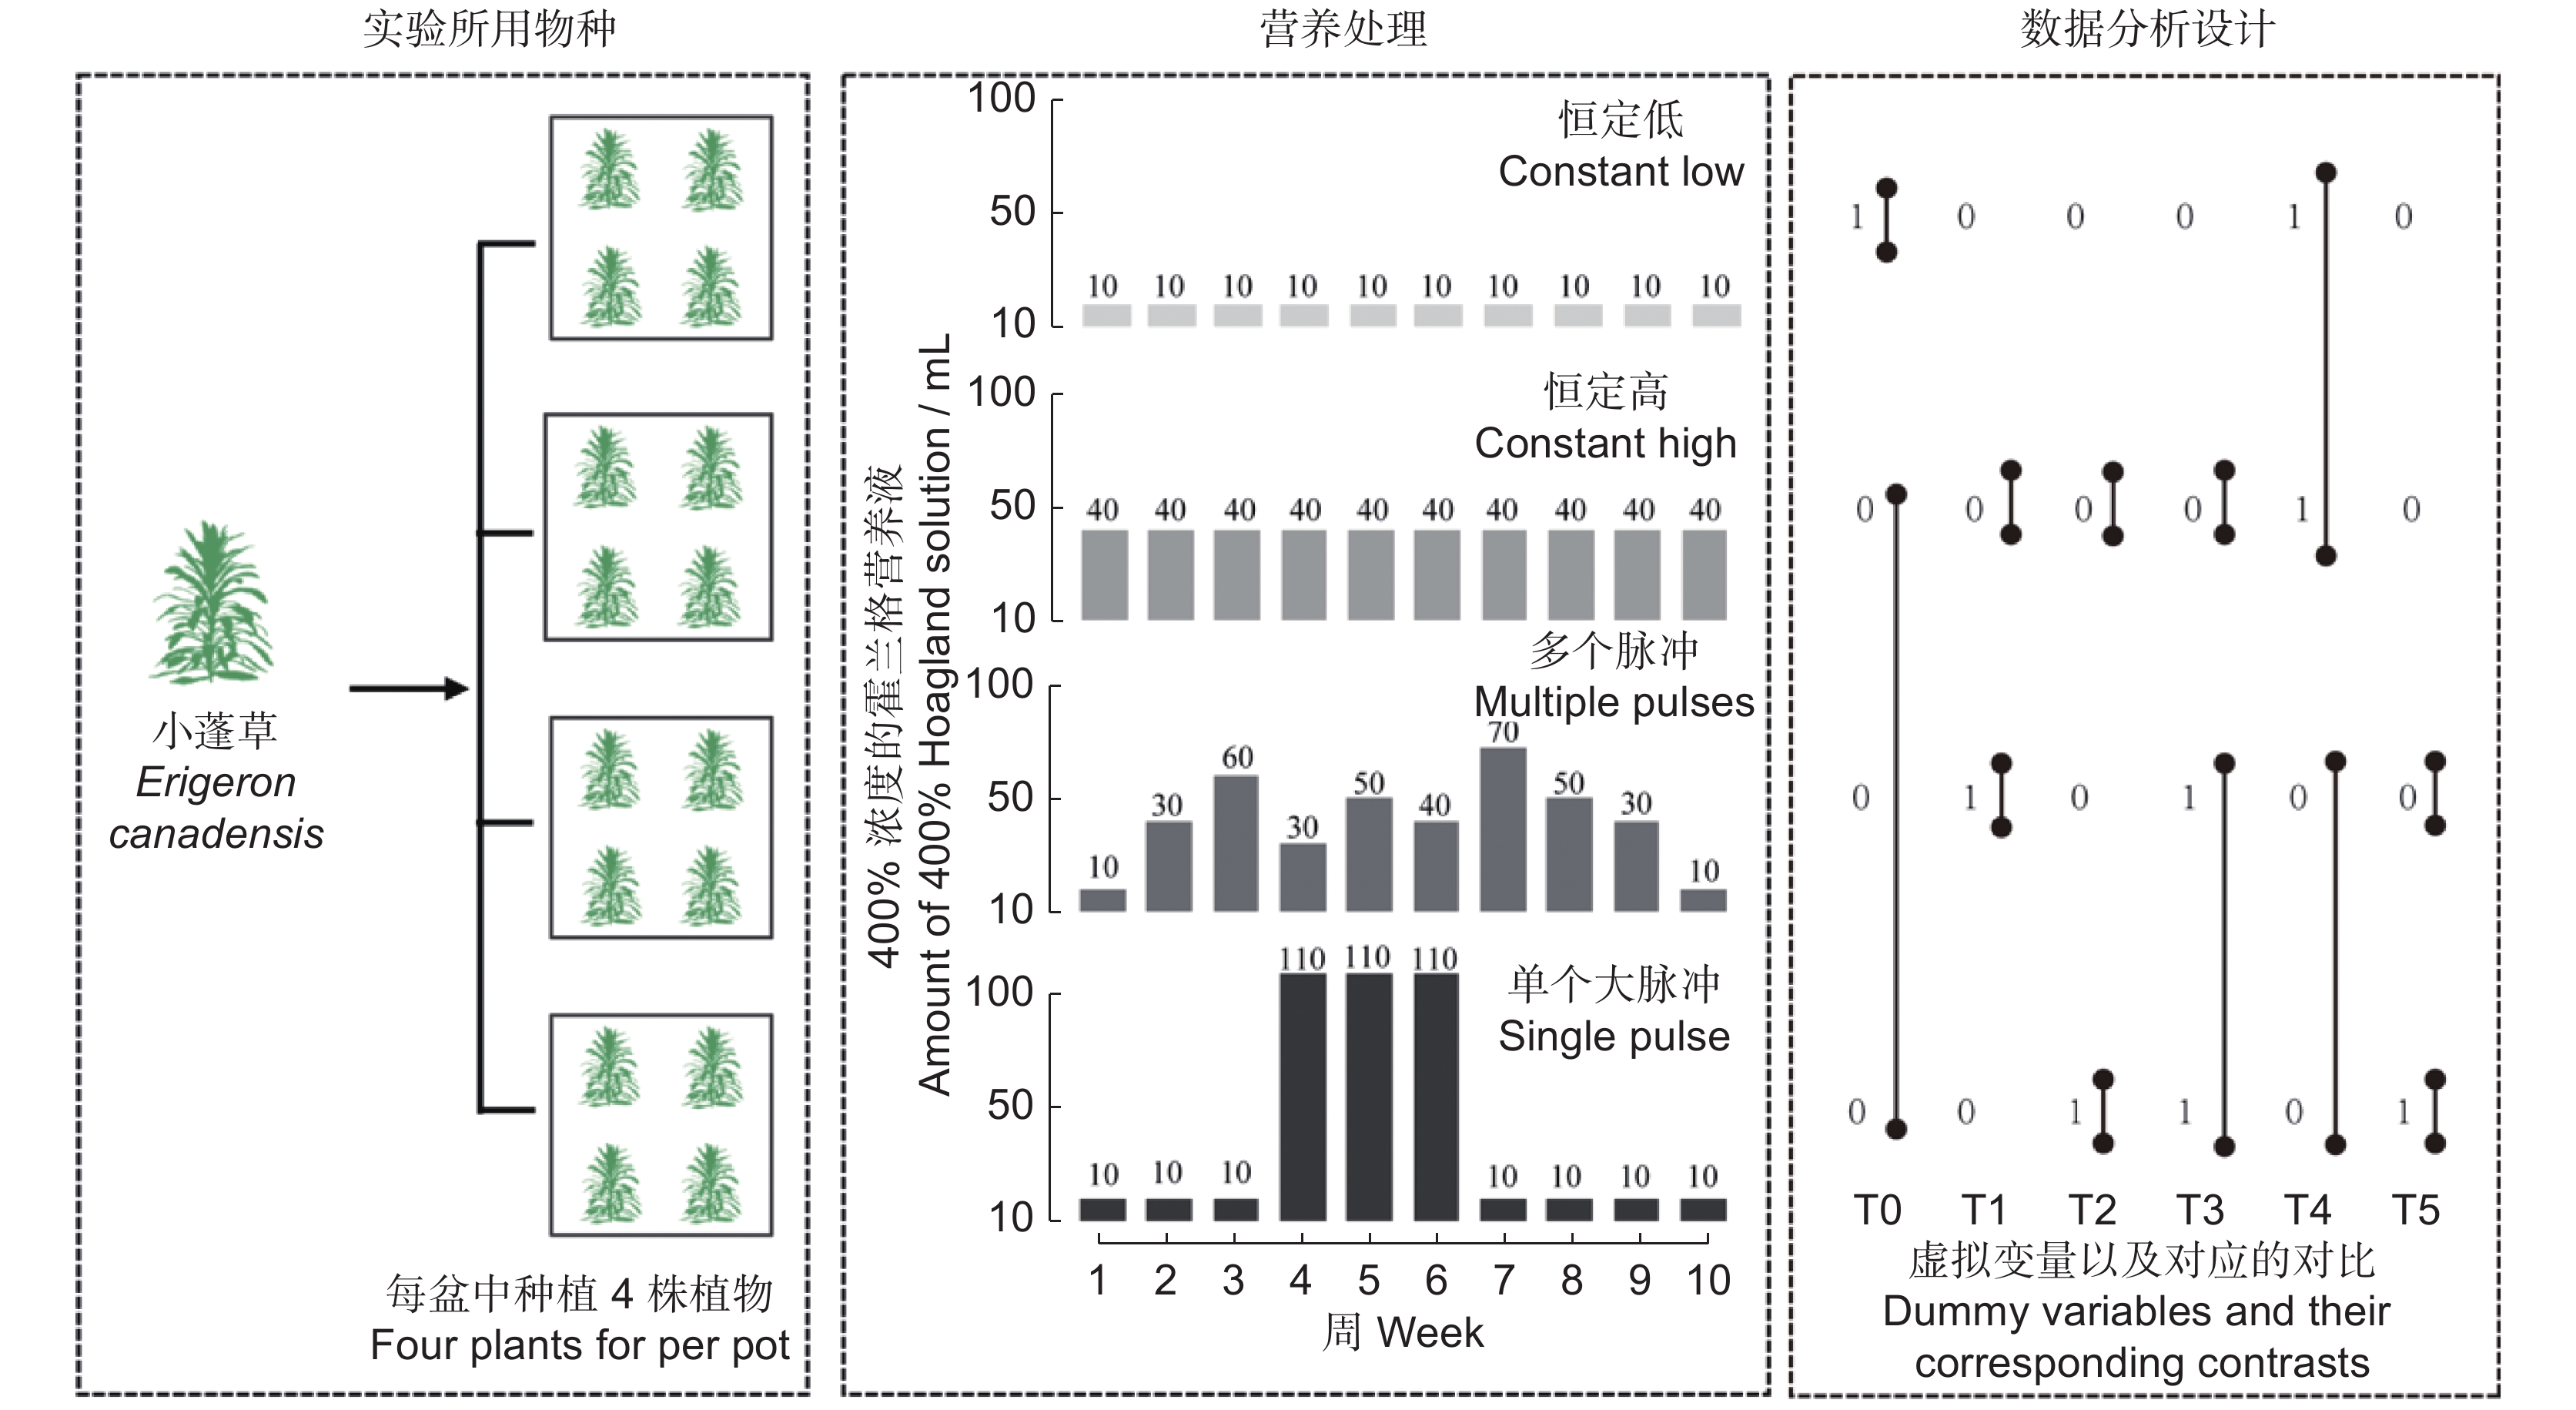
![]() 图 1 实验设计实验包括4种不同的营养处理(恒定低、恒定高、多个小脉冲以及单个大脉冲)。右侧虚线框内表示在实验的10周内每周供应的营养液总量。在恒定高、多脉冲和单个大脉冲中,营养供应的总量是相同的。在数据分析设计中,使用虚拟变量编码来检验平均营养供应水平(恒定低和3个高营养处理的平均值,T0),营养变异性(恒定高与营养脉冲的每一种,T1 ~ T2;营养脉冲之间,T5)以及营养波动(恒定高与营养脉冲,T3)的影响。Figure 1. Graphical illustration of experimental designExperiment included four different nutrient treatments (constant low, constant high, multiple pulses, and single pulse). Amount of nutrient solution supplied each week over 10 weeks of the experiment is stated in right dotted box. In constant high, multiple pulses, and single pulse treatments, total nutrient supply was the same. For data analysis, dummy variable coding was used to examine mean nutrient supply level (constant low and average across three high nutrient treatments, T0), nutrient variability (constant high and each nutrient pulses, T1–T2; between nutrient pulses, T5) as well as the effects of nutrient fluctuations (constant high vs. nutrient pulses, T3).
图 1 实验设计实验包括4种不同的营养处理(恒定低、恒定高、多个小脉冲以及单个大脉冲)。右侧虚线框内表示在实验的10周内每周供应的营养液总量。在恒定高、多脉冲和单个大脉冲中,营养供应的总量是相同的。在数据分析设计中,使用虚拟变量编码来检验平均营养供应水平(恒定低和3个高营养处理的平均值,T0),营养变异性(恒定高与营养脉冲的每一种,T1 ~ T2;营养脉冲之间,T5)以及营养波动(恒定高与营养脉冲,T3)的影响。Figure 1. Graphical illustration of experimental designExperiment included four different nutrient treatments (constant low, constant high, multiple pulses, and single pulse). Amount of nutrient solution supplied each week over 10 weeks of the experiment is stated in right dotted box. In constant high, multiple pulses, and single pulse treatments, total nutrient supply was the same. For data analysis, dummy variable coding was used to examine mean nutrient supply level (constant low and average across three high nutrient treatments, T0), nutrient variability (constant high and each nutrient pulses, T1–T2; between nutrient pulses, T5) as well as the effects of nutrient fluctuations (constant high vs. nutrient pulses, T3).1.3 数据收集
移植12周后,开始收获。在收获开始的第1 d,我们分别选取了植物的上、中、下3片叶子,使用叶绿素仪测量了叶绿素含量。然后,随机选择3片发育完全的叶子,使用图像分析软件(Digimizer)测量植物叶面积。80 ℃烘干后测量叶片干重,比叶面积(Specific leaf area,SLA)通过叶面积除以叶片干重计算。分别收获每盆中小蓬草的地上部分和地下部分。实验收获的所有样品在80 ℃下干燥72 h后,称重。
1.4 数据分析
为了探究不同的营养供应水平(低与高)以及营养供应的频率(恒定高与两种营养脉冲形式)对小蓬草种群生长的影响,使用NLME包中的lme函数拟合了线性混合效应模型[30]。在混合模型分析中,植物的地上、地下生物量、根冠比、叶绿素含量以及比叶面积作为模型中的响应变量。我们把营养水平(低与高)、营养波动(恒定高与营养波动)、营养变异性(恒定高与营养脉冲的每一种以及营养脉冲之间)以及它们的交互作用作为模型中的固定效应。由于营养变异性嵌套在高营养水平内,我们将营养处理编码为所有模型中的虚拟变量T0 ~ T5(图1),以获得不同处理的对比[19, 31]。采用R语言内置函数“Shapiro. test”检验数据的正态性,若不满足正态性则对数据进行对数转换使其满足要求[32]。所有的数据分析都在R 4.1.2 软件[33]中进行。
2. 结果与分析
2.1 入侵植物小蓬草对平均营养可用性的响应
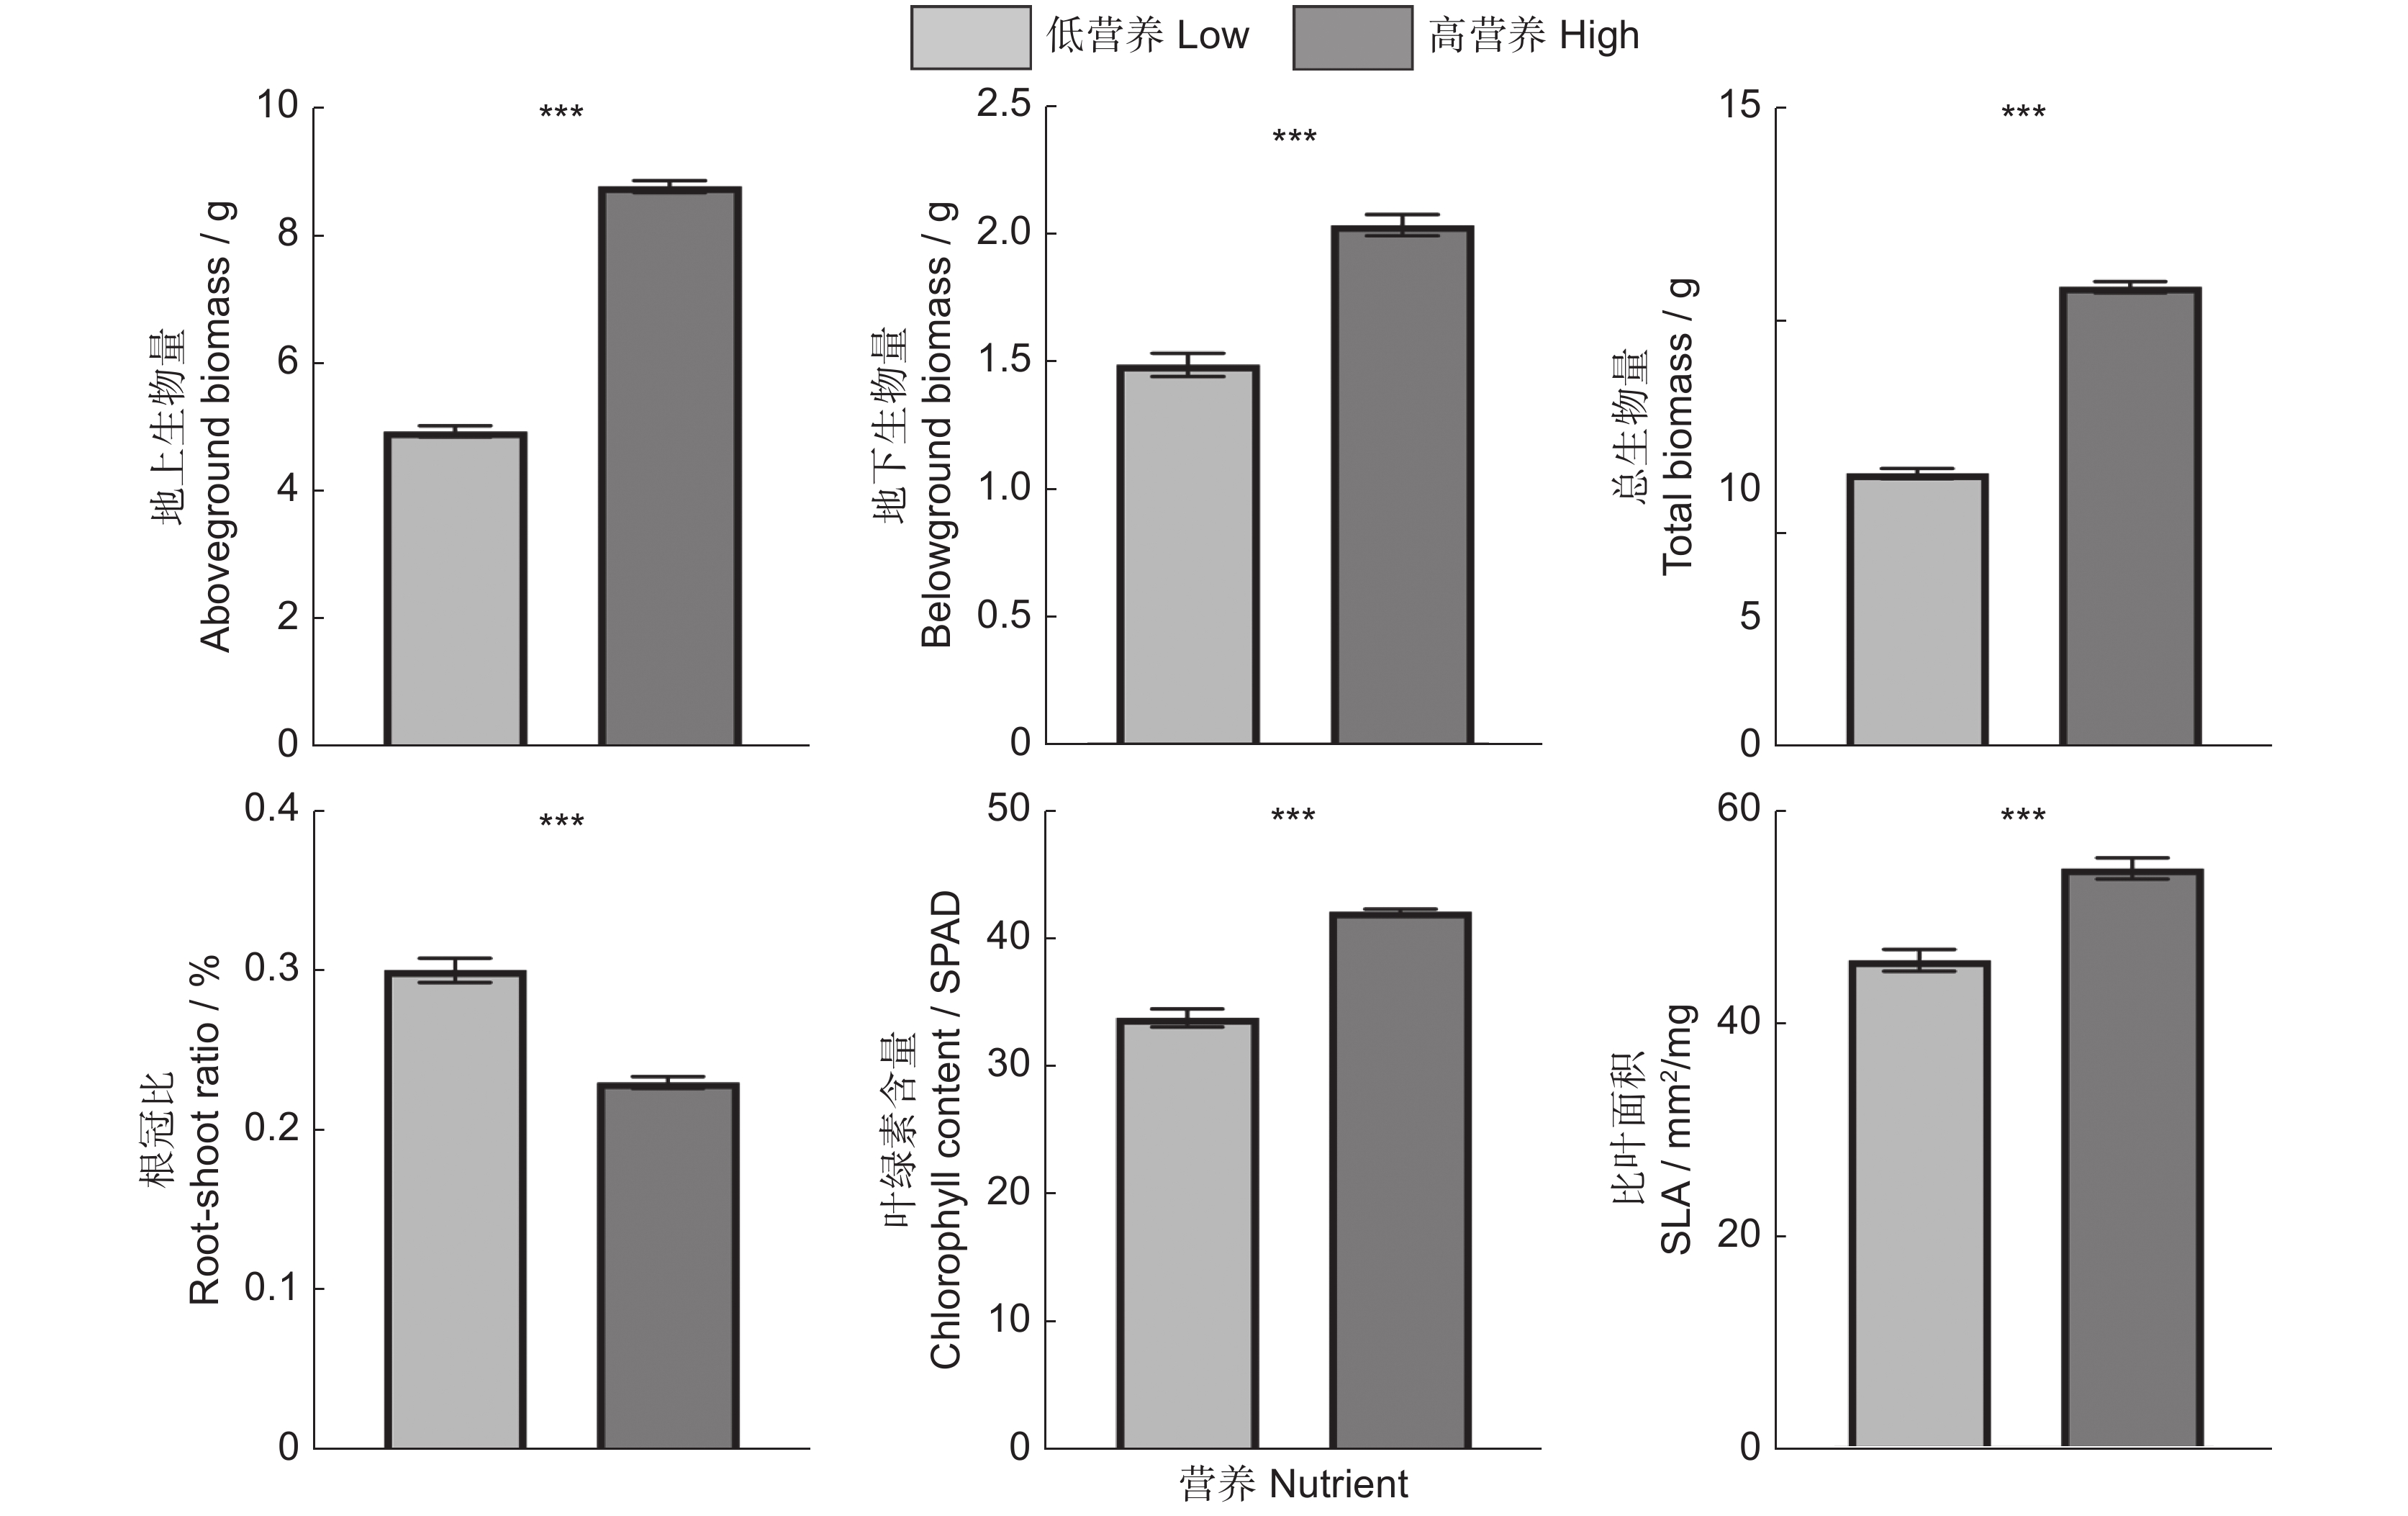
通过对小蓬草的地上、地下以及总生物量进行线性混合效应模型分析发现,平均营养供应的增加(恒定高、多个小脉冲以及单个大脉冲)显著地提高了外来入侵植物小蓬草的地上、地下生物量以及总生物量,也即营养供应的增加能够明显促进小蓬草的生长。另外,小蓬草的叶绿素含量以及比叶面积的大小也有显著的增加,但是在高营养处理下的根冠比要明显低于恒定的低营养处理(表1、图2)。
表 1 营养处理对小蓬草地上、地下生物量、总生物量、根冠比、叶绿素含量、比叶面积的线性混合效应模型分析Table 1. Linear mixed effect model analysis of nutrient treatments on aboveground, underground biomass, total biomass, root-to-shoot ratio, chlorophyll content, and specific leaf area of Erigeron canadensis固定因子
Fixed effects地上生物量
Aboveground
biomass地下生物量
Belowground
biomass总生物量
Total biomass根冠比
Root - shoot
ratio叶绿素含量
Chlorophyll
content比叶面积
Specific leaf
aread.f. χ2 P d.f. χ2 P d.f. χ2 P d.f. χ2 P d.f. χ2 P d.f. χ2 P 低营养 vs.
高营养(T0)1 31.711 <0.001 1 10.793 0.001 1 28.868 <0.001 1 14.443 <0.001 1 17.246 <0.001 1 5.674 0.017 持续高 vs. 多
个小脉冲(T1)1 1.265 0.261 1 5.005 0.025 1 2.446 0.118 1 4.497 0.034 1 0.019 0.889 1 9.548 0.002 持续高 vs. 单
个大脉冲(T2)1 7.404 0.007 1 10.771 0.001 1 0.816 0.366 1 20.542 <0.001 1 1.025 0.311 1 1.24 0.265 高 vs. 脉冲
(T3)1 0.636 0.425 1 7.186 0.007 1 0.128 0.72 1 6.988 0.008 1 0.149 0.698 1 4.043 0.043 多个小脉冲 vs.
单个大脉冲(T5)1 0.502 0.479 1 0.748 0.387 1 0.662 0.416 1 7.455 0.006 1 1.245 0.265 1 3.445 0.063 注:显著性差异(P < 0.05)以粗体表示。 Note: Significant effects (P < 0.05) are in bold. ![]() 图 2 小蓬草地上、地下生物量、总生物量、根冠比、叶绿素含量、比叶面积对低营养和高营养的响应误差棒代表平均值的SE。***,P < 0.001。下同。Figure 2. Responses of aboveground biomass, underground biomass, total biomass, root-shoot ratio, chlorophyll content, and SLA of Erigeron canadensis to low and high nutrient treatmentsError bars represent SE of means. Same below.
图 2 小蓬草地上、地下生物量、总生物量、根冠比、叶绿素含量、比叶面积对低营养和高营养的响应误差棒代表平均值的SE。***,P < 0.001。下同。Figure 2. Responses of aboveground biomass, underground biomass, total biomass, root-shoot ratio, chlorophyll content, and SLA of Erigeron canadensis to low and high nutrient treatmentsError bars represent SE of means. Same below.2.2 入侵植物小蓬草对营养脉冲的响应
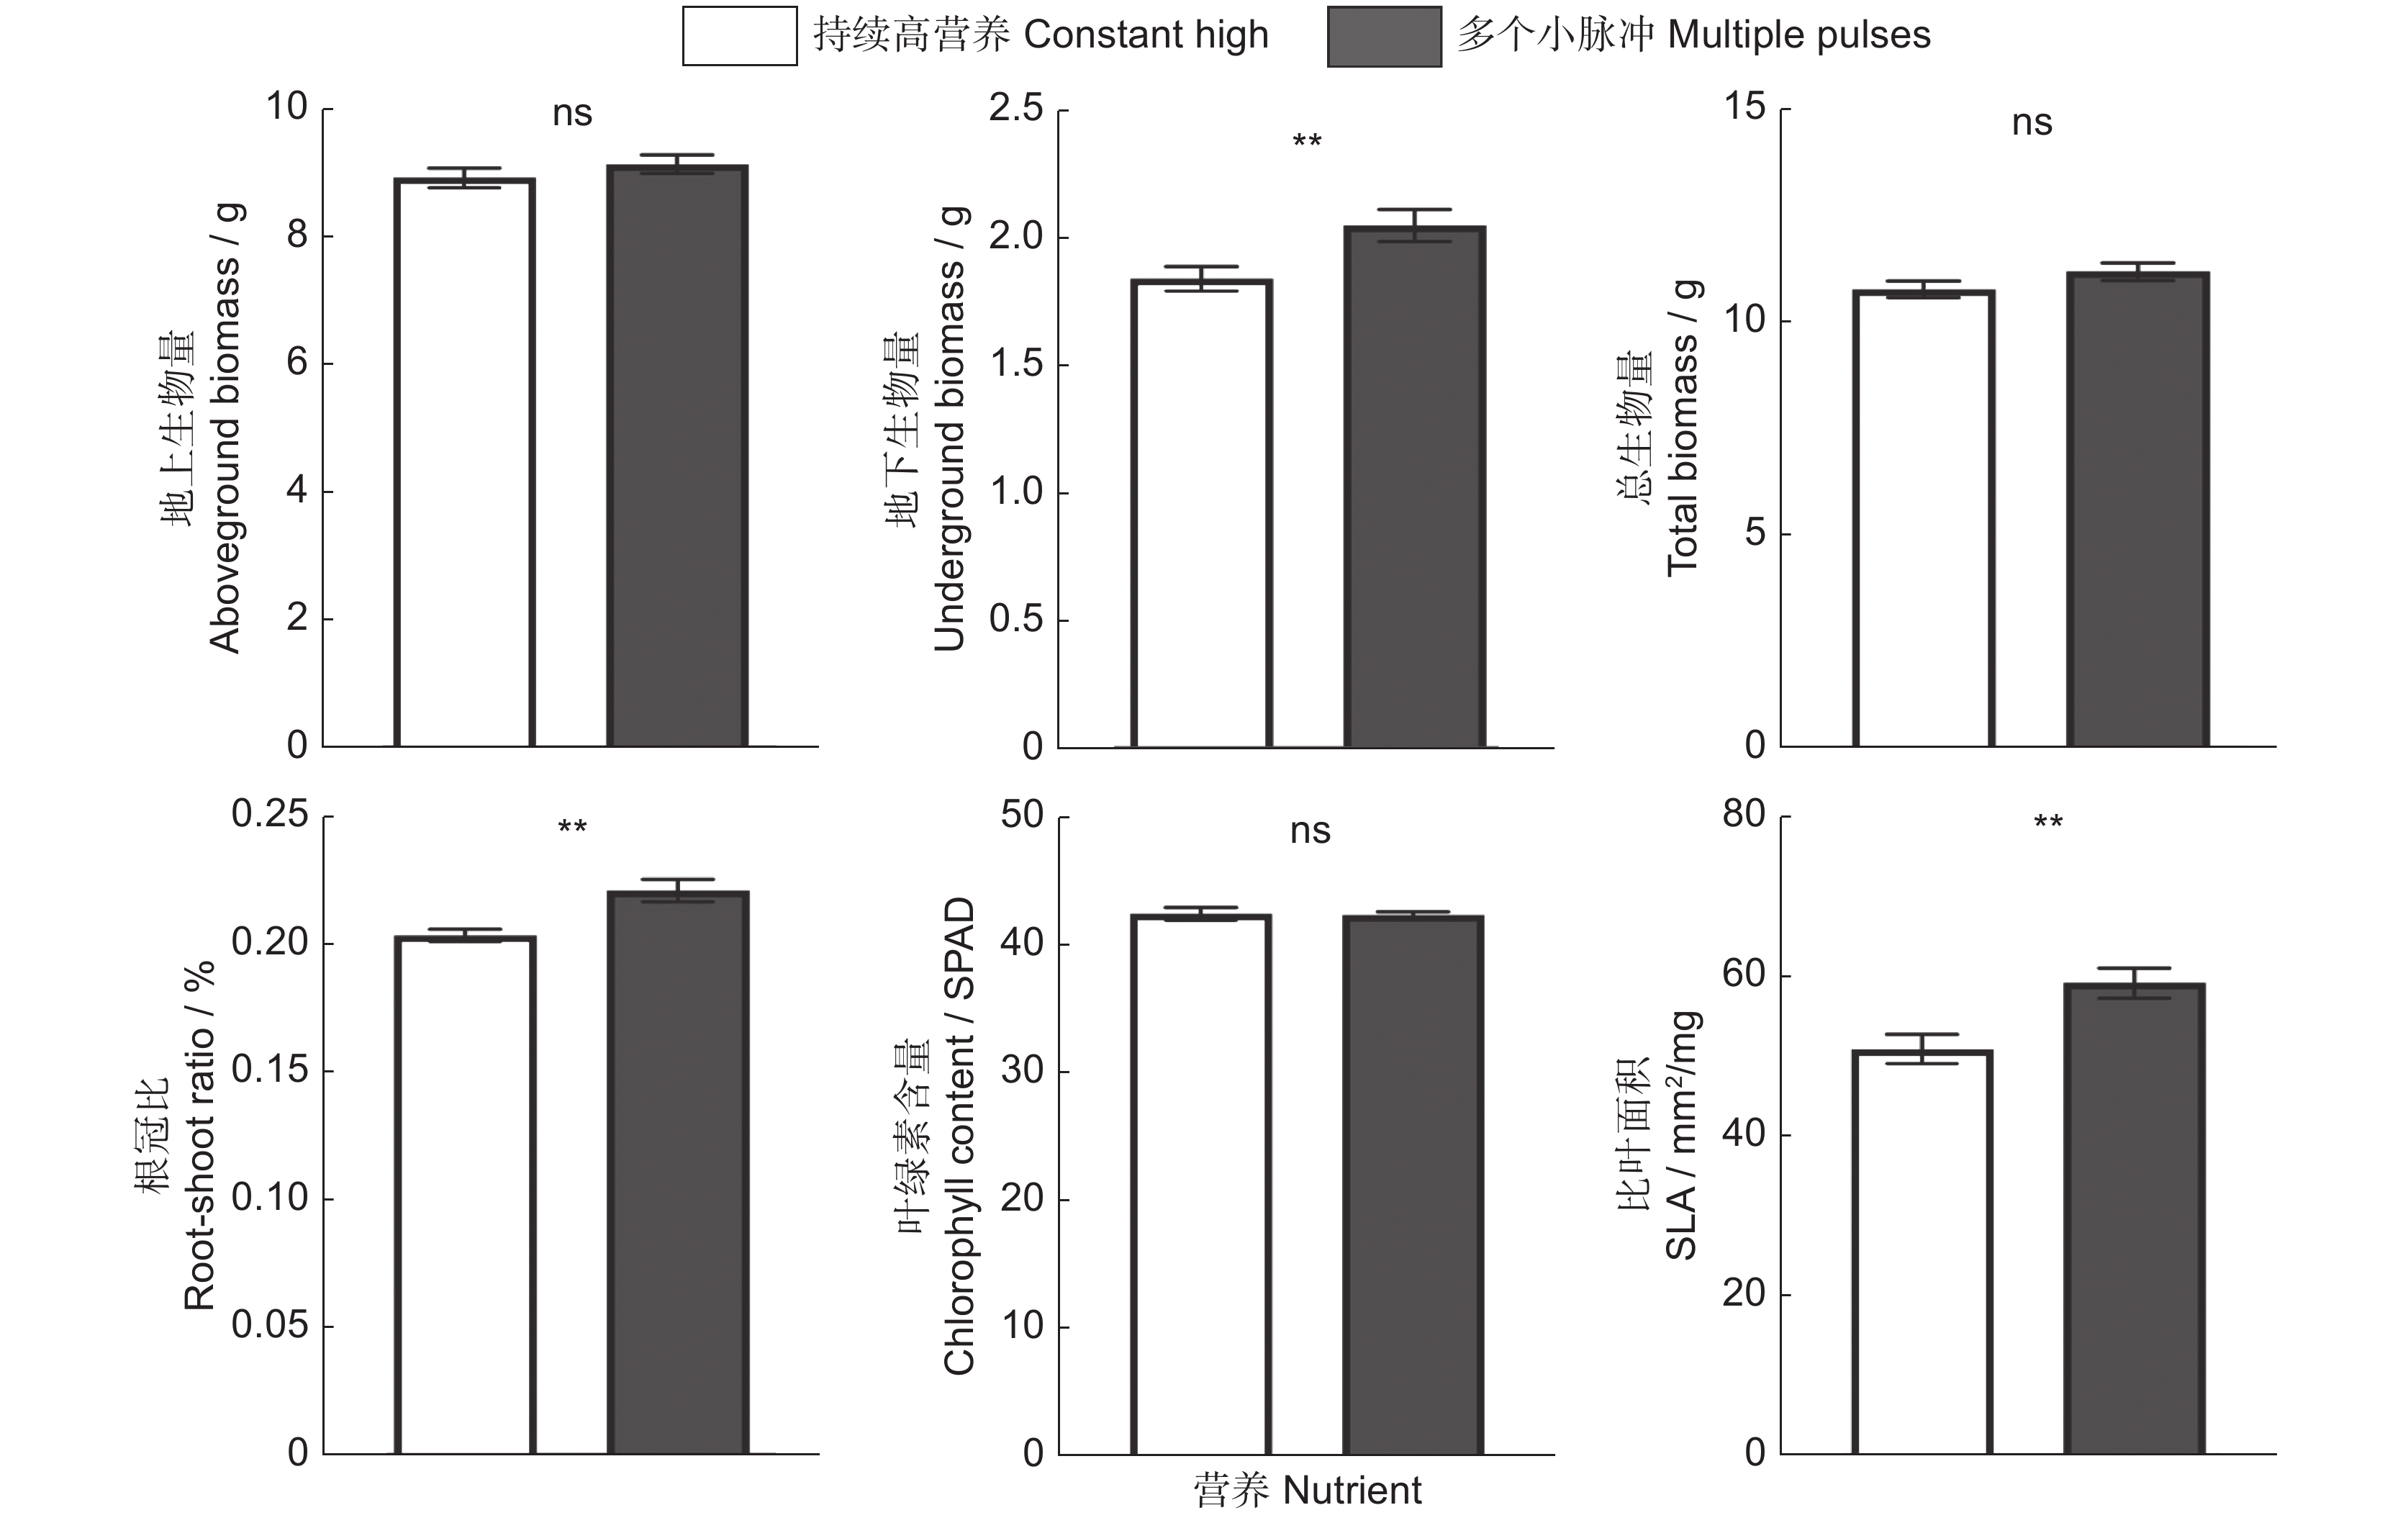
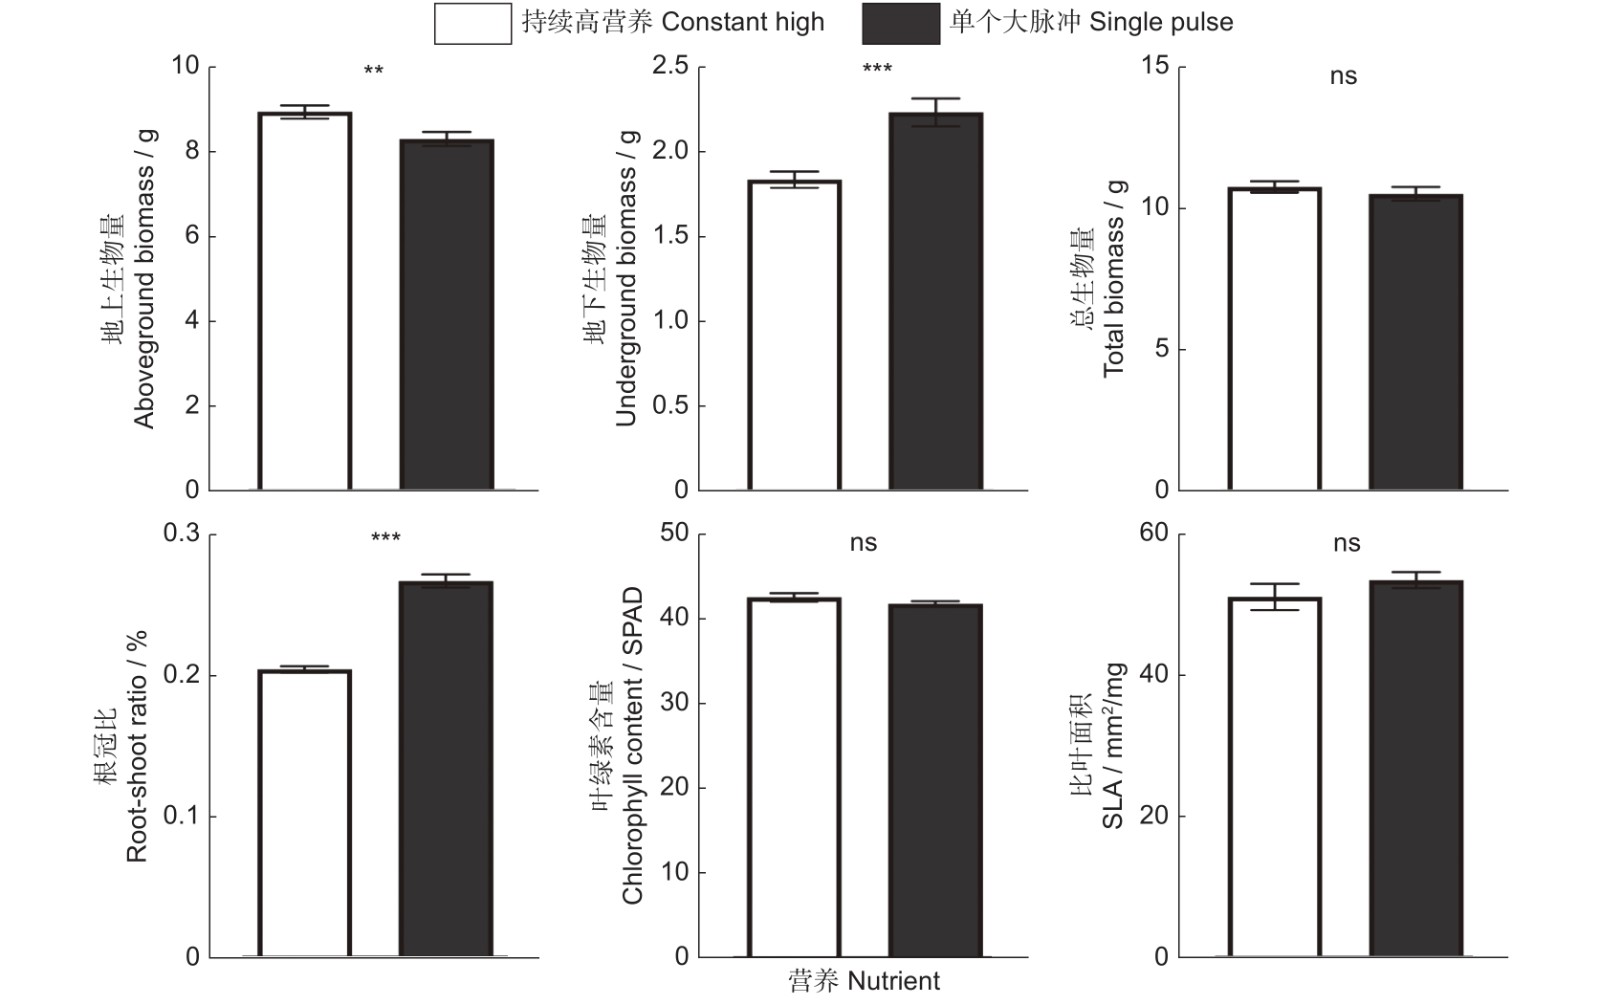
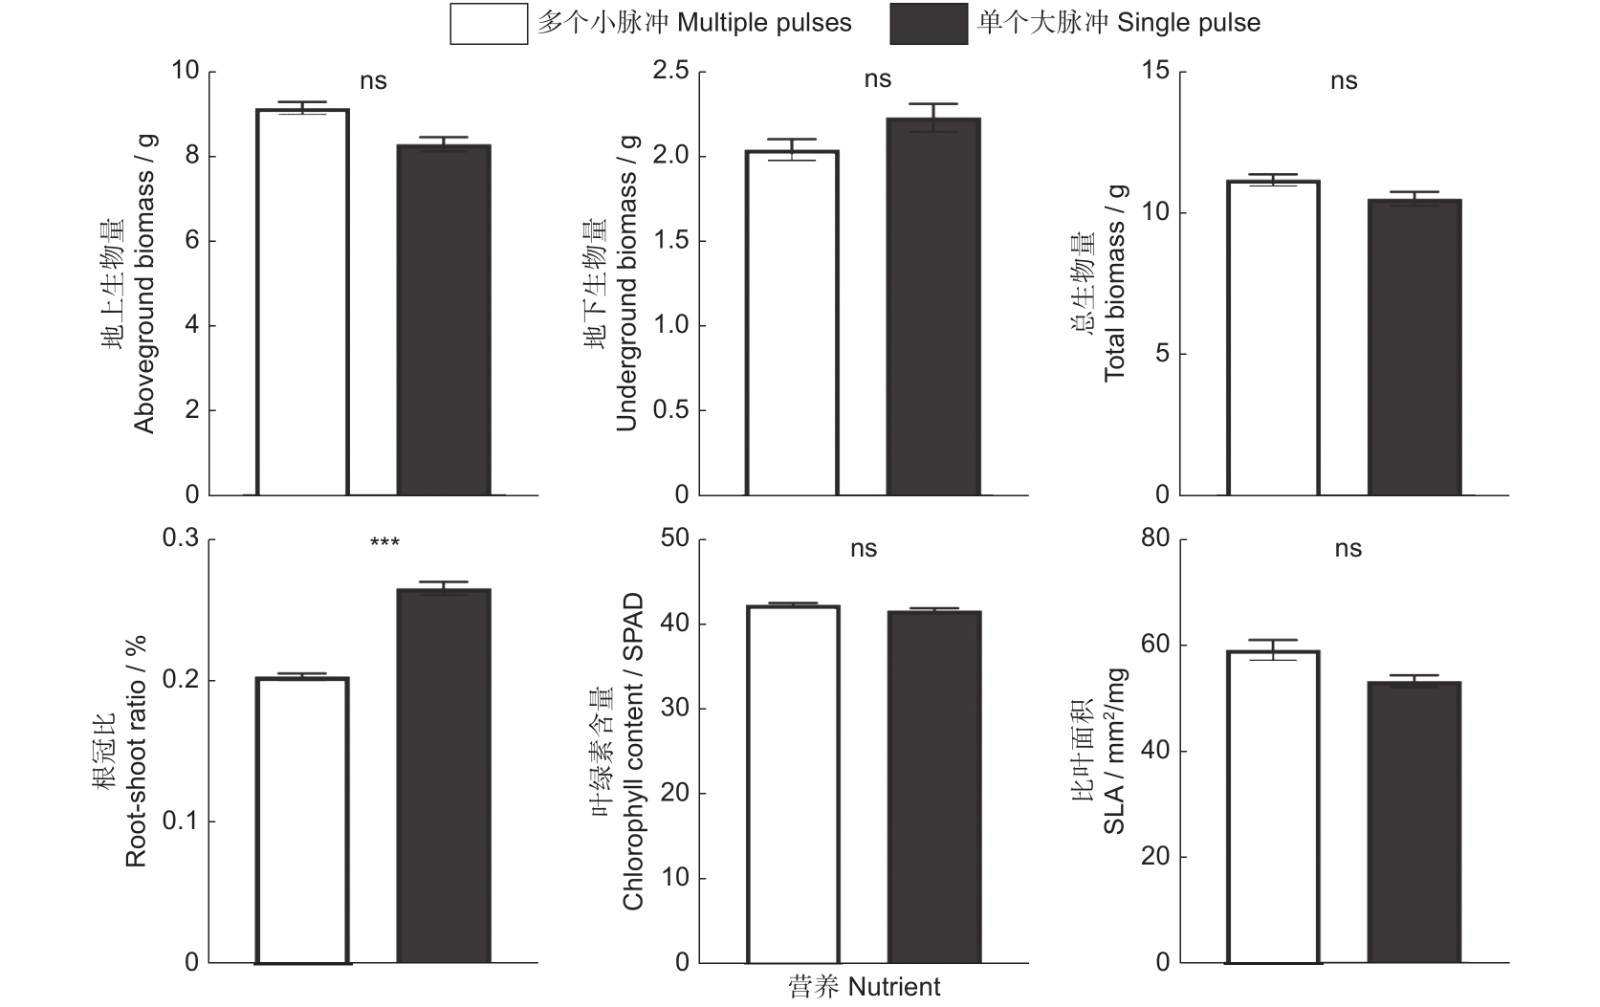
当营养以多个小脉冲的形式提供时,相比于恒定的高营养处理,小蓬草的地上生物量、总生物量以及叶绿素含量并没有显著改变,但是却显著增加了小蓬草的地下生物量、根冠比以及比叶面积的大小(表1、图3)。外来植物小蓬草在生长过程中以单一大脉冲的营养供应时,其地下生物量、根冠比有显著的增加,但是其总生物量、叶绿素含量以及比叶面积不受到营养是作为单个大脉冲还是恒定速率供应的影响。有趣的是,单个大脉冲处理显著地降低了小蓬草的地上生物量(表1、图4)。与恒定高营养相比,小蓬草的总生物量以及叶绿素含量既不受单一大脉冲的影响,也不受多个小脉冲的影响(表1,图3 ~ 图5)。
![]() 图 3 小蓬草地上、地下生物量、总生物量、根冠比、叶绿素含量、比叶面积对恒定高营养和多个小脉冲的响应Figure 3. Responses of aboveground biomass, underground biomass, total biomass, root-shoot ratio, chlorophyll content, and SLA of Erigeron canadensis to constant high nutrient and multiple pulse treatments**:P<0.01;ns:P>0.05. Same below.
图 3 小蓬草地上、地下生物量、总生物量、根冠比、叶绿素含量、比叶面积对恒定高营养和多个小脉冲的响应Figure 3. Responses of aboveground biomass, underground biomass, total biomass, root-shoot ratio, chlorophyll content, and SLA of Erigeron canadensis to constant high nutrient and multiple pulse treatments**:P<0.01;ns:P>0.05. Same below.![]() 图 4 小蓬草地上、地下生物量、总生物量、根冠比、叶绿素含量、比叶面积对恒定高营养和单个大脉冲的响应Figure 4. Responses of aboveground biomass, underground biomass, total biomass, root-shoot ratio, chlorophyll content, and SLA of Erigeron canadensis to constant high nutrient and single pulse treatments
图 4 小蓬草地上、地下生物量、总生物量、根冠比、叶绿素含量、比叶面积对恒定高营养和单个大脉冲的响应Figure 4. Responses of aboveground biomass, underground biomass, total biomass, root-shoot ratio, chlorophyll content, and SLA of Erigeron canadensis to constant high nutrient and single pulse treatments![]() 图 5 小蓬草地上、地下生物量、总生物量、根冠比、叶绿素含量、比叶面积对恒定高营养和营养脉冲的响应Figure 5. Responses of aboveground biomass, underground biomass, total biomass, root-shoot ratio, chlorophyll content, and SLA of Erigeron canadensis to constant high nutrient and nutrient pulse treatments
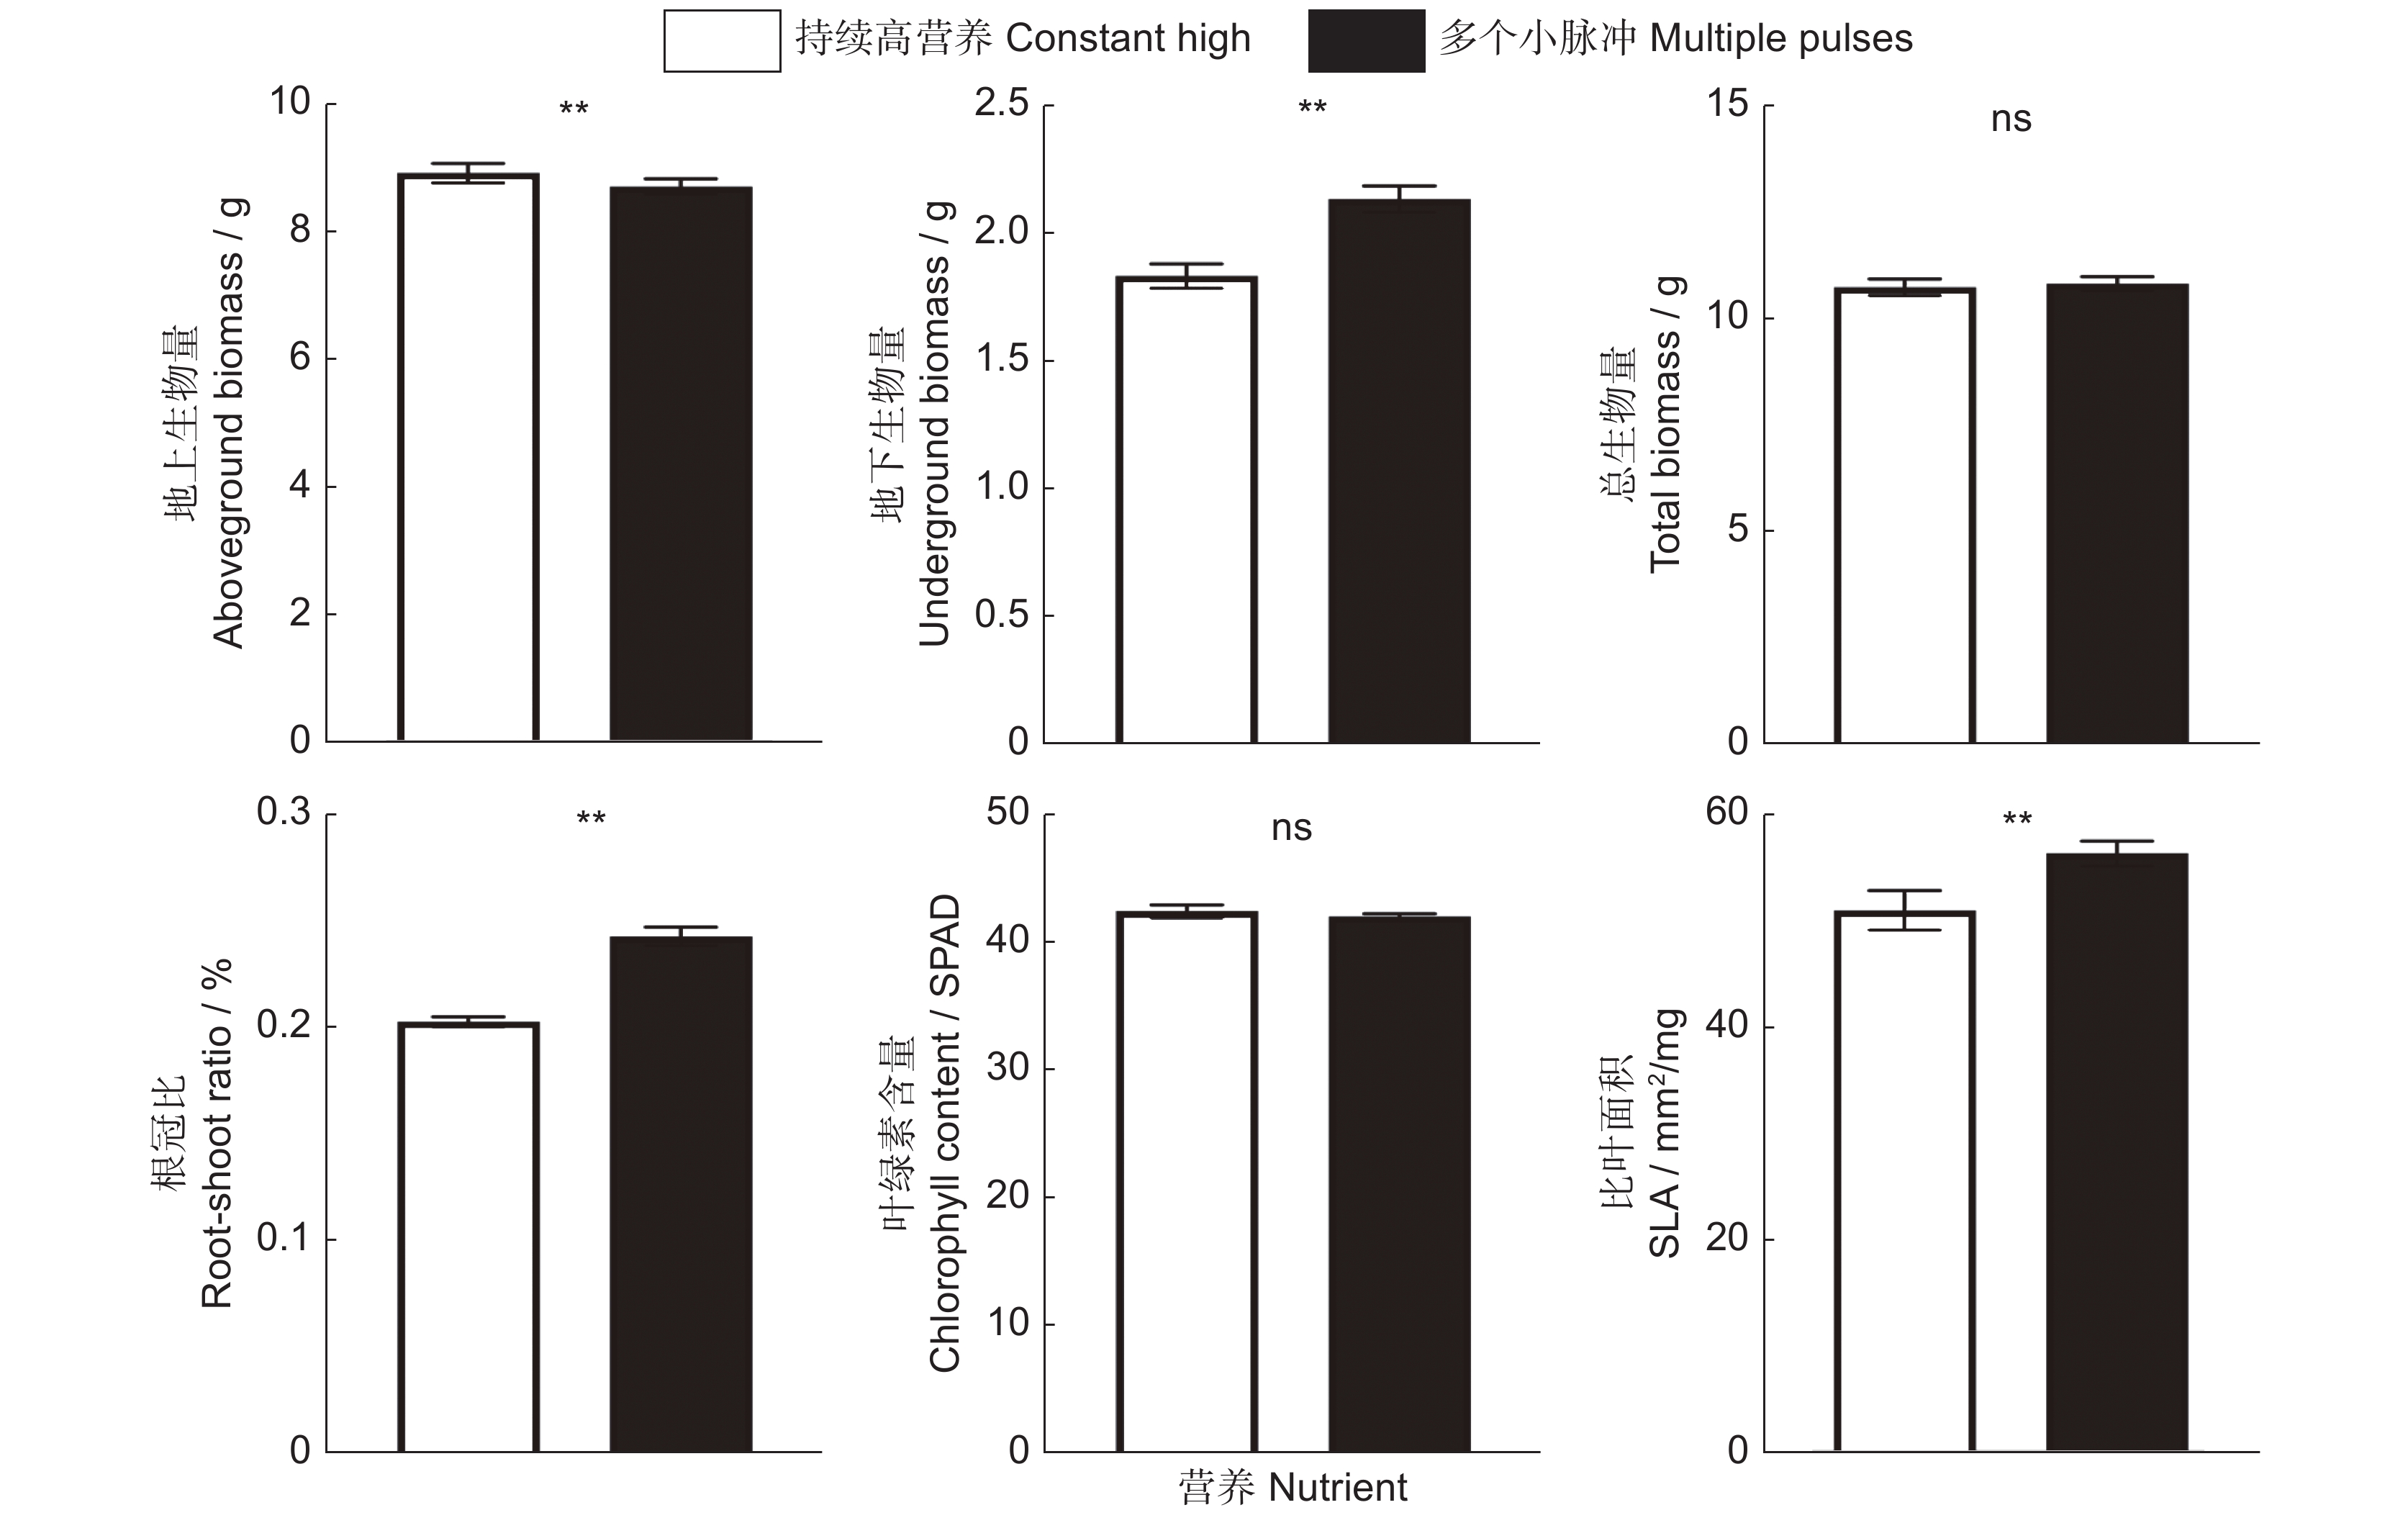
图 5 小蓬草地上、地下生物量、总生物量、根冠比、叶绿素含量、比叶面积对恒定高营养和营养脉冲的响应Figure 5. Responses of aboveground biomass, underground biomass, total biomass, root-shoot ratio, chlorophyll content, and SLA of Erigeron canadensis to constant high nutrient and nutrient pulse treatments总之,相比于恒定的营养处理,营养脉冲并不会改变小蓬草的地上生物量、总生物量以及叶片中的叶绿素含量,与之相反,营养脉冲会显著促进小蓬草地下生物量、根冠比以及比叶面积的大小(表1、图5)。另外,我们发现,营养脉冲供给的时间模式的不同除了能够显著增加小蓬草根冠比外,并不会对其他指标产生显著的影响(表1、图6)。
![]() 图 6 小蓬草地上、地下生物量、总生物量、根冠比、叶绿素含量、比叶面积对多个小脉冲和单个大脉冲的响应Figure 6. Responses of aboveground biomass, underground biomass, total biomass, root-shoot ratio, chlorophyll content, and SLA of Erigeron canadensis to multiple and single pulse treatments
图 6 小蓬草地上、地下生物量、总生物量、根冠比、叶绿素含量、比叶面积对多个小脉冲和单个大脉冲的响应Figure 6. Responses of aboveground biomass, underground biomass, total biomass, root-shoot ratio, chlorophyll content, and SLA of Erigeron canadensis to multiple and single pulse treatments3. 讨论
3.1 营养添加促进小蓬草的生长
研究表明,增加可利用的资源可以促进外来植物的入侵[7, 13, 18]。与之前的研究结果一致,小蓬草种群的整体生物量随着平均营养的增加都表现出了相似的响应,即在高营养条件下都比在低营养条件下产生的更多生物量,这表明群落中可利用资源的增加有利于外来植物的生长。同时我们发现,入侵植物小蓬草的根冠比随着营养平均水平的增加显著下降,即随着平均营养可用性的增加,小蓬草明显减少了对根系资源的相对分配,从而增加对地上部分的投资以达到更快速的生长目的。这也符合“最优资源分配假说”,即植物会将生物量分配给有助于它们获得更多限制资源的结构上[34, 35]。例如,Huang等[36]的研究指出,与低营养条件相比,更高的营养供应会显著促进入侵植物地上生物量的积累。同样,Constance等[37]的研究也发现,土壤中的养分含量是红树林地上生物量最重要的驱动因素。总之,这些结果表明,由于外来入侵植物物种间存在高度的竞争耐受性而导致入侵植物在高资源环境中仍有利于彼此的生长,从而造成外来入侵植物对于平均营养供应增加的响应也更强烈,这可能是外来物种入侵成功背后的重要驱动机制之一。
3.2 营养脉冲有利于小蓬草地下生物量的积累
外来入侵植物小蓬草对不同营养脉冲的响应是不同的。当营养以多个小脉冲的形式提供时,小蓬草的地下生物量有明显的增高趋势,植物将更多的生物量分配给根部。根系的主要功能之一是帮助植物从土壤中吸收养分来促进生长,根系分配和形态的可塑性变化对于养分有效性的响应可以优化植物的养分获取,进而优化其性能[38, 39]。例如,Keser等[40]的研究指出,营养供应的空间异质性使得植物在高营养斑块中产生的根比低营养斑块的根更多、更长、更细,这增加了整体生物量。但是,营养处理对地上生物量以及总生物量的改变是微乎其微的。我们发现,与恒定的高营养供应相比,植物的地上、地下生物量的分配差异似乎并没有造成植物总生物量的差异。这与以往的研究结果一致,如Liu等[19]通过设置多个不同形式的营养添加方式探究营养脉冲对外来入侵植物和本地植物的影响发现,外来入侵植物的生物量生产以及根质量分数并不受到多个小脉冲还是恒定频率供应的影响。对此可能的一个解释是,多个小的营养脉冲处理对入侵植物的影响效果总体上很小,因为这种处理方式与恒定营养供应处理非常相似,这是由于后者实际上是由相同大小的多个小脉冲而组成的[19]。
对于单个大营养脉冲处理而言,小蓬草的地下生物量有明显的增高趋势,但是对地上生物量却呈现出抑制的表现,这与前人研究的结果相似[41]。该研究表明,相比于恒定的养分供应,当以单个大脉冲的形式提供营养时,外来目标植物的绝对和相对地上生物量都表现出减少的趋势。同时与非入侵性的外来物种相比,入侵性的外来物种相对生物量减少甚至更大,而且以多个较小的脉冲提供营养时,也发现了类似的模式。基于资源限制理论[32],人们通常会认为减少根生物量分配以响应营养的增加将是有益的。然而,可用的营养在短暂性增加的情况下,例如在单个营养脉冲期间,外来植物拥有较高的地下生物量可以允许它们迅速地吸收和利用短暂的过剩营养。另外,在我们的研究中相较于恒定的高营养供应,单个大营养脉冲处理对小蓬草的总生物量却没有产生显著性的改变。该部分结果也得到Liu等[19]的支持,他们的研究指出外来入侵植物的总生物量没有明显地从营养脉冲中受益。我们的结果与Parepa等[20]的发现不一致,他们的研究结果显示高侵入性的日本虎杖不仅受益于单个大脉冲,也受益于多个小幅度的营养脉冲。对此一个可能的解释是,我们的研究中小蓬草仅仅只在种内竞争的情况下生长,而Parepa等[20]的研究是在一个本地植物群落中探究入侵植物的生长如何因营养的波动而不同。
3.3 营养脉冲的形式不同不影响小蓬草的生长
资源脉冲的时间供应变化可能会改变它们对植物的影响,因为植物的生长阶段对于决定资源吸收的能力至关重要[21]。例如,Tulloss和Cadenasso[42]发现施肥对植物生长初期有很强的积极影响,而对衰老期的植物则无影响。Tao等[21]的研究也发现,在低水平下,中晚期提供的营养脉冲促进了外来入侵植物的生长以及入侵。然而,我们通过对比两种不同时间供应模式的营养脉冲,却发现不同的时间供应模式对于小蓬草的生长并没有产生特别显著的影响,仅对小蓬草的根冠比产生了显著的效应。本研究中,多个小脉冲和单个大脉冲对植物的地下部分都有促进作用,但是单个大脉冲的促进作用会更多一点。出现结果的原因可能是由于大脉冲提供的营养时间处于植物生长最旺盛的时期,对于营养的需求较为强烈。另外,一些研究指出,资源脉冲对植物入侵成功的影响取决于邻近植物的资源类型和身份。Zheng等[43]的研究指出,在营养脉冲处理下,飞机草(Chromolaena odorata (L.) R. M. King & H. Robinson)在竞争条件下比本地物种具有更高的优势,而在单一栽培条件下则不然。我们的研究与其部分结论类似,即并没有发现不同营养脉冲间的差异,同种植物对于资源的需求相同,可能会由于其激烈的竞争作用抵消掉了不同营养脉冲所带来的效应,未来的研究可能要考虑设置不同的邻近植物探究营养脉冲的影响[44]。
4. 结论
自“生物入侵”这一概念被提出以来,对外来物种成功入侵机制的研究越来越引起人们的重视[45]。我们的研究发现,能够更好地利用增加的可用性资源可能是驱动外来植物形成入侵的重要因素之一。此外,尽管在营养波动条件下,外来植物的地上生物量没有特别明显的变化,但是地下生物量却有了较大幅度的增加。因此,本研究强调环境中资源的波动会对植物的地下部分产生更强烈的影响,这可能是由于根系作为吸收营养的主要器官之一对于资源的变化更为敏感。未来的研究可能要更多关注地下部分对于入侵物种的重要意义。研究结果说明,环境中资源的波动会改变入侵植物的生物量分配策略进而影响其生长。
-
![]()
图 1 实验设计
实验包括4种不同的营养处理(恒定低、恒定高、多个小脉冲以及单个大脉冲)。右侧虚线框内表示在实验的10周内每周供应的营养液总量。在恒定高、多脉冲和单个大脉冲中,营养供应的总量是相同的。在数据分析设计中,使用虚拟变量编码来检验平均营养供应水平(恒定低和3个高营养处理的平均值,T0),营养变异性(恒定高与营养脉冲的每一种,T1 ~ T2;营养脉冲之间,T5)以及营养波动(恒定高与营养脉冲,T3)的影响。
Figure 1. Graphical illustration of experimental design
Experiment included four different nutrient treatments (constant low, constant high, multiple pulses, and single pulse). Amount of nutrient solution supplied each week over 10 weeks of the experiment is stated in right dotted box. In constant high, multiple pulses, and single pulse treatments, total nutrient supply was the same. For data analysis, dummy variable coding was used to examine mean nutrient supply level (constant low and average across three high nutrient treatments, T0), nutrient variability (constant high and each nutrient pulses, T1–T2; between nutrient pulses, T5) as well as the effects of nutrient fluctuations (constant high vs. nutrient pulses, T3).
![]()
图 2 小蓬草地上、地下生物量、总生物量、根冠比、叶绿素含量、比叶面积对低营养和高营养的响应
误差棒代表平均值的SE。***,P < 0.001。下同。
Figure 2. Responses of aboveground biomass, underground biomass, total biomass, root-shoot ratio, chlorophyll content, and SLA of Erigeron canadensis to low and high nutrient treatments
Error bars represent SE of means. Same below.
![]()
图 3 小蓬草地上、地下生物量、总生物量、根冠比、叶绿素含量、比叶面积对恒定高营养和多个小脉冲的响应
Figure 3. Responses of aboveground biomass, underground biomass, total biomass, root-shoot ratio, chlorophyll content, and SLA of Erigeron canadensis to constant high nutrient and multiple pulse treatments
**:P<0.01;ns:P>0.05. Same below.
![]()
图 4 小蓬草地上、地下生物量、总生物量、根冠比、叶绿素含量、比叶面积对恒定高营养和单个大脉冲的响应
Figure 4. Responses of aboveground biomass, underground biomass, total biomass, root-shoot ratio, chlorophyll content, and SLA of Erigeron canadensis to constant high nutrient and single pulse treatments
![]()
图 5 小蓬草地上、地下生物量、总生物量、根冠比、叶绿素含量、比叶面积对恒定高营养和营养脉冲的响应
Figure 5. Responses of aboveground biomass, underground biomass, total biomass, root-shoot ratio, chlorophyll content, and SLA of Erigeron canadensis to constant high nutrient and nutrient pulse treatments
![]()
图 6 小蓬草地上、地下生物量、总生物量、根冠比、叶绿素含量、比叶面积对多个小脉冲和单个大脉冲的响应
Figure 6. Responses of aboveground biomass, underground biomass, total biomass, root-shoot ratio, chlorophyll content, and SLA of Erigeron canadensis to multiple and single pulse treatments
表 1 营养处理对小蓬草地上、地下生物量、总生物量、根冠比、叶绿素含量、比叶面积的线性混合效应模型分析
Table 1 Linear mixed effect model analysis of nutrient treatments on aboveground, underground biomass, total biomass, root-to-shoot ratio, chlorophyll content, and specific leaf area of Erigeron canadensis
固定因子
Fixed effects地上生物量
Aboveground
biomass地下生物量
Belowground
biomass总生物量
Total biomass根冠比
Root - shoot
ratio叶绿素含量
Chlorophyll
content比叶面积
Specific leaf
aread.f. χ2 P d.f. χ2 P d.f. χ2 P d.f. χ2 P d.f. χ2 P d.f. χ2 P 低营养 vs.
高营养(T0)1 31.711 <0.001 1 10.793 0.001 1 28.868 <0.001 1 14.443 <0.001 1 17.246 <0.001 1 5.674 0.017 持续高 vs. 多
个小脉冲(T1)1 1.265 0.261 1 5.005 0.025 1 2.446 0.118 1 4.497 0.034 1 0.019 0.889 1 9.548 0.002 持续高 vs. 单
个大脉冲(T2)1 7.404 0.007 1 10.771 0.001 1 0.816 0.366 1 20.542 <0.001 1 1.025 0.311 1 1.24 0.265 高 vs. 脉冲
(T3)1 0.636 0.425 1 7.186 0.007 1 0.128 0.72 1 6.988 0.008 1 0.149 0.698 1 4.043 0.043 多个小脉冲 vs.
单个大脉冲(T5)1 0.502 0.479 1 0.748 0.387 1 0.662 0.416 1 7.455 0.006 1 1.245 0.265 1 3.445 0.063 注:显著性差异(P < 0.05)以粗体表示。 Note: Significant effects (P < 0.05) are in bold.  下载: 导出CSV
-
[1] Capinha C,Essl F,Seebens H,Moser D,Pereira HM. The dispersal of alien species redefines biogeography in the Anthropocene[J]. Science,2015,348 (6240):1248−1251. doi: 10.1126/science.aaa8913
[2] Seebens H,Blackburn TM,Dyer EE,Genovesi P,Hulme PE,et al. No saturation in the accumulation of alien species worldwide[J]. Nat Commun,2017,8 (1):14435. doi: 10.1038/ncomms14435
[3] Seebens H,Bacher S,Blackburn TM,Capinha C,Dawson W,et al. Projecting the continental accumulation of alien species through to 2050[J]. Global Change Biol,2021,27 (5):970−982. doi: 10.1111/gcb.15333
[4] Vitousek PM,D’Antonio CM,Loope LL,Westbrooks R. Biological invasions as global environmental change[J]. Am Sci,1996,84 (5):468−478.
[5] Vitousek PM,Mooney HA,Lubchenco J,Melillo JM. Human domination of earth’s ecosystems[J]. Science,1997,277 (5325):494−499. doi: 10.1126/science.277.5325.494
[6] Dawson W,Burslem DFRP,Hulme PE. Factors explaining alien plant invasion success in a tropical ecosystem differ at each stage of invasion[J]. J Ecol,2009,97 (4):657−665. doi: 10.1111/j.1365-2745.2009.01519.x
[7] Dawson W,Fischer M,van Kleunen M. Common and rare plant species respond differently to fertilisation and competition,whether they are alien or native[J]. Ecol Lett,2012,15 (8):873−880. doi: 10.1111/j.1461-0248.2012.01811.x
[8] Van Kleunen M,Dawson W,Essl F,Pergl J,Winter M,et al. Global exchange and accumulation of non-native plants[J]. Nature,2015,525 (7567):100−103. doi: 10.1038/nature14910
[9] Van Kleunen M,Bossdorf O,Dawson W. The ecology and evolution of alien plants[J]. Annu Rev Ecol Evol Syst,2018,49:25−47. doi: 10.1146/annurev-ecolsys-110617-062654
[10] Bradley BA,Blumenthal DM,Wilcove DS,Ziska LH. Predicting plant invasions in an era of global change[J]. Trends Ecol Evol,2010,25 (5):310−318. doi: 10.1016/j.tree.2009.12.003
[11] Davis MA,Grime JP,Thompson K. Fluctuating resources in plant communities:a general theory of invasibility[J]. J Ecol,2000,88 (3):528−534. doi: 10.1046/j.1365-2745.2000.00473.x
[12] Enders M,Havemann F,Ruland F,Bernard-Verdier M,Catford JA,et al. A conceptual map of invasion biology:integrating hypotheses into a consensus network[J]. Global Ecol Biogeogr,2020,29 (6):978−991. doi: 10.1111/geb.13082
[13] Liu YJ,Oduor AMO,Zhang Z,Manea A,Tooth IM,et al. Do invasive alien plants benefit more from global environmental change than native plants?[J]. Global Change Biol,2017,23 (8):3363−3370. doi: 10.1111/gcb.13579
[14] Manea A,Leishman MR. Competitive interactions between established grasses and woody plant seedlings under elevated CO2 levels are mediated by soil water availability[J]. Oecologia,2015,177 (2):499−506. doi: 10.1007/s00442-014-3143-z
[15] Easterling DR,Meehl GA,Parmesan C,Changnon SA,Karl TR,et al. Climate extremes:observations,modeling,and impacts[J]. Science,2000,289 (5487):2068−2074. doi: 10.1126/science.289.5487.2068
[16] Smith MD. An ecological perspective on extreme climatic events:a synthetic definition and framework to guide future research[J]. J Ecol,2011,99 (3):656−663. doi: 10.1111/j.1365-2745.2011.01798.x
[17] Yang LH,Bastow JL,Spence KO,Wright AN. What can we learn from resource pulses[J]. Ecology,2008,89 (3):621−634. doi: 10.1890/07-0175.1
[18] Davis MA,Pelsor M. Experimental support for a resource-based mechanistic model of invasibility[J]. Ecol Lett,2001,4 (5):421−428. doi: 10.1046/j.1461-0248.2001.00246.x
[19] Liu YJ,van Kleunen M. Responses of common and rare aliens and natives to nutrient availability and fluctuations[J]. J Ecol,2017,105 (4):1111−1122. doi: 10.1111/1365-2745.12733
[20] Parepa M,Fischer M,Bossdorf O. Environmental variability promotes plant invasion[J]. Nat Commun,2013,4 (1):1604. doi: 10.1038/ncomms2632
[21] Tao ZB,Shen CC,Qin WC,Gui YF,Wang Y,et al. Magnitude and timing of resource pulses interact to affect plant invasion[J]. Oikos,2021,130 (11):1967−1975. doi: 10.1111/oik.08381
[22] Pyšek P,Pergl J,Essl F,Lenzner B,Dawson W,et al. Naturalized alien flora of the world:species diversity,taxonomic and phylogenetic patterns,geographic distribution and global hotspots of plant invasion[J]. Preslia,2017,89 (3):203−274. doi: 10.23855/preslia.2017.203
[23] Yan HY,Feng L,Zhao YF,Feng L,Zhu CP,et al. Predicting the potential distribution of an invasive species,Erigeron canadensis L.,in China with a maximum entropy model[J]. Global Ecol Conserv,2020,21:e00822. doi: 10.1016/j.gecco.2019.e00822
[24] Dauer JT,Mortensen DA,Vangessel MJ. Temporal and spatial dynamics of long-distance Conyza canadensis seed dispersal[J]. J Appl Ecol,2007,44 (1):105−114.
[25] Main CL,Mueller TC,Hayes RM,Wilkerson JB. Response of selected horseweed (Conyza canadensis (L. ) Cronq. ) populations to glyphosate[J]. J Agric Food Chem,2004,52 (4):879−883. doi: 10.1021/jf0351927
[26] Nandula VK,Eubank TW,Poston DH,Koger CH,Reddy KN. Factors affecting germination of horseweed (Conyza canadensis)[J]. Weed Sci,2006,54 (5):898−902. doi: 10.1614/WS-06-006R2.1
[27] Wang CY,Jiang K,Zhou JW,Xiao HG,Wang L. Responses of soil bacterial communities to Conyza canadensis invasion with different cover classes along a climatic gradient[J]. Clean−Soil,Air,Water,2018,46 (8):1800212.
[28] 徐海根,强胜,韩正敏,郭建英,黄宗国,等. 中国外来入侵物种的分布与传入路径分析[J]. 生物多样性,2004,12(6):626−638. doi: 10.3321/j.issn:1005-0094.2004.06.008 Xu HG,Qiang S,Han ZM,Guo JY,Huang ZG,et al. The distribution and introduction pathway of alien invasive species in China[J]. Biodiversity Science,2004,12 (6):626−638. doi: 10.3321/j.issn:1005-0094.2004.06.008
[29] Wu BD,Zhang HS,Jiang K,Zhou JW,Wang CY. Erigeron canadensis affects the taxonomic and functional diversity of plant communities in two climate zones in the North of China[J]. Ecol Res,2019,34 (4):535−547. doi: 10.1111/1440-1703.12024
[30] Pinheiro J, Bates D, DebRoy S, Sarkar D. nlme: linear and nonlinear mixed effects models. 2021, R package version 4.1-121[CP]. (2021-01-01)[2023-08-25].https://CRAN.Rproject. org/package=nlme/.
[31] Schielzeth H. Simple means to improve the interpretability of regression coefficients[J]. Methods Ecol Evol,2010,1 (2):103−113. doi: 10.1111/j.2041-210X.2010.00012.x
[32] Hothorn T,Bretz F,Westfall P. Simultaneous inference in general parametric models[J]. Biom J,2008,50 (3):346−363. doi: 10.1002/bimj.200810425
[33] R Core Team. R: a language and environment for statistical computing[CP]. (2021-01-01)[2023-08-25].https: //www.R- proje ct. org.
[34] Bloom AJ,Chapin FS,Mooney HA. Resource limitation in plants-an economic analogy[J]. Annu Rev Ecol Syst,1985,16:363−392. doi: 10.1146/annurev.es.16.110185.002051
[35] Poorter H,Nagel O. The role of biomass allocation in the growth response of plants to different levels of light,CO2,nutrients and water:a quantitative review[J]. Funct Plant Biol,2000,27 (12):1191−1191. doi: 10.1071/PP99173_CO
[36] Huang QQ,Fan ZW,Li XX,Wang Y,Liu Y,Shen YD. Effects of nutrient addition and clipping on biomass production of invasive and native annual Asteraceae plants[J]. Weed Res,2018,58 (4):318−326. doi: 10.1111/wre.12308
[37] Constance A,Oehri J,Bunbury N,Wiesenberg GLB,Pennekamp F,et al. Soil nutrient content and water level variation drive mangrove forest aboveground biomass in the lagoonal ecosystem of Aldabra Atoll[J]. Ecol Ind,2022,143:109292. doi: 10.1016/j.ecolind.2022.109292
[38] De Kroon H,Hendriks M,van Ruijven J,Ravenek J,Padilla FM,et al. Root responses to nutrients and soil biota:drivers of species coexistence and ecosystem productivity[J]. J Ecol,2012,100 (1):6−15. doi: 10.1111/j.1365-2745.2011.01906.x
[39] Grossman JD,Rice KJ. Evolution of root plasticity responses to variation in soil nutrient distribution and concentration[J]. Evol Appl,2012,5 (8):850−857. doi: 10.1111/j.1752-4571.2012.00263.x
[40] Keser LH,Visser EJW,Dawson W,Song YB,Yu FH,et al. Herbaceous plant species invading natural areas tend to have stronger adaptive root foraging than other naturalized species[J]. Front Plant Sci,2015,6:273.
[41] Liu YJ,Zhang XQ,van Kleunen M. Increases and fluctuations in nutrient availability do not promote dominance of alien plants in synthetic communities of common natives[J]. Funct Ecol,2018,32 (11):2594−2604. doi: 10.1111/1365-2435.13199
[42] Tulloss EM,Cadenasso ML. The effect of nitrogen deposition on plant performance and community structure:is it life stage specific?[J]. PLoS One,2016,11 (6):e0156685. doi: 10.1371/journal.pone.0156685
[43] Zheng YL,Liao ZY,Li WT,Wang RF,Li L,et al. The effect of resource pulses on the competitiveness of a tropical invader depends on identity of resident species and resource type[J]. Acta Oecol,2020,102:103507. doi: 10.1016/j.actao.2019.103507
[44] Sun Y,Collins AR,Schaffner U,Müller-Schärer H. Dissecting impact of plant invaders:do invaders behave differently in the new range?[J]. Ecology,2013,94 (10):2124−2130. doi: 10.1890/12-1910.1
[45] Horvitz N,Wang R,Wan FH,Nathan R. Pervasive human-mediated large-scale invasion:analysis of spread patterns and their underlying mechanisms in 17 of China’s worst invasive plants[J]. J Ecol,2017,105 (1):85−94. doi: 10.1111/1365-2745.12692
-
期刊类型引用(2)
1. 梁泽鹏,王昌萍,周环屿,罗瑞康,武俊喜,拉多. 西藏拉萨亏组山4种常见植物的比叶面积与叶片含水率:围封和海拔效应. 西藏科技. 2024(02): 16-25 .  百度学术
百度学术
2. 付兴飞,胡发广,喻好好,李贵平,李亚男,李亚麒,毕晓菲,彭海明,石华忠,邓家有. 西双版纳咖啡园杂草危害调查. 热带农业科技. 2024(04): 23-28 . 百度学术
其他类型引用(2)
计量
- 文章访问数: 400
- HTML全文浏览量: 23
- PDF下载量: 91
- 被引次数: 4
