Figures of the Article
-
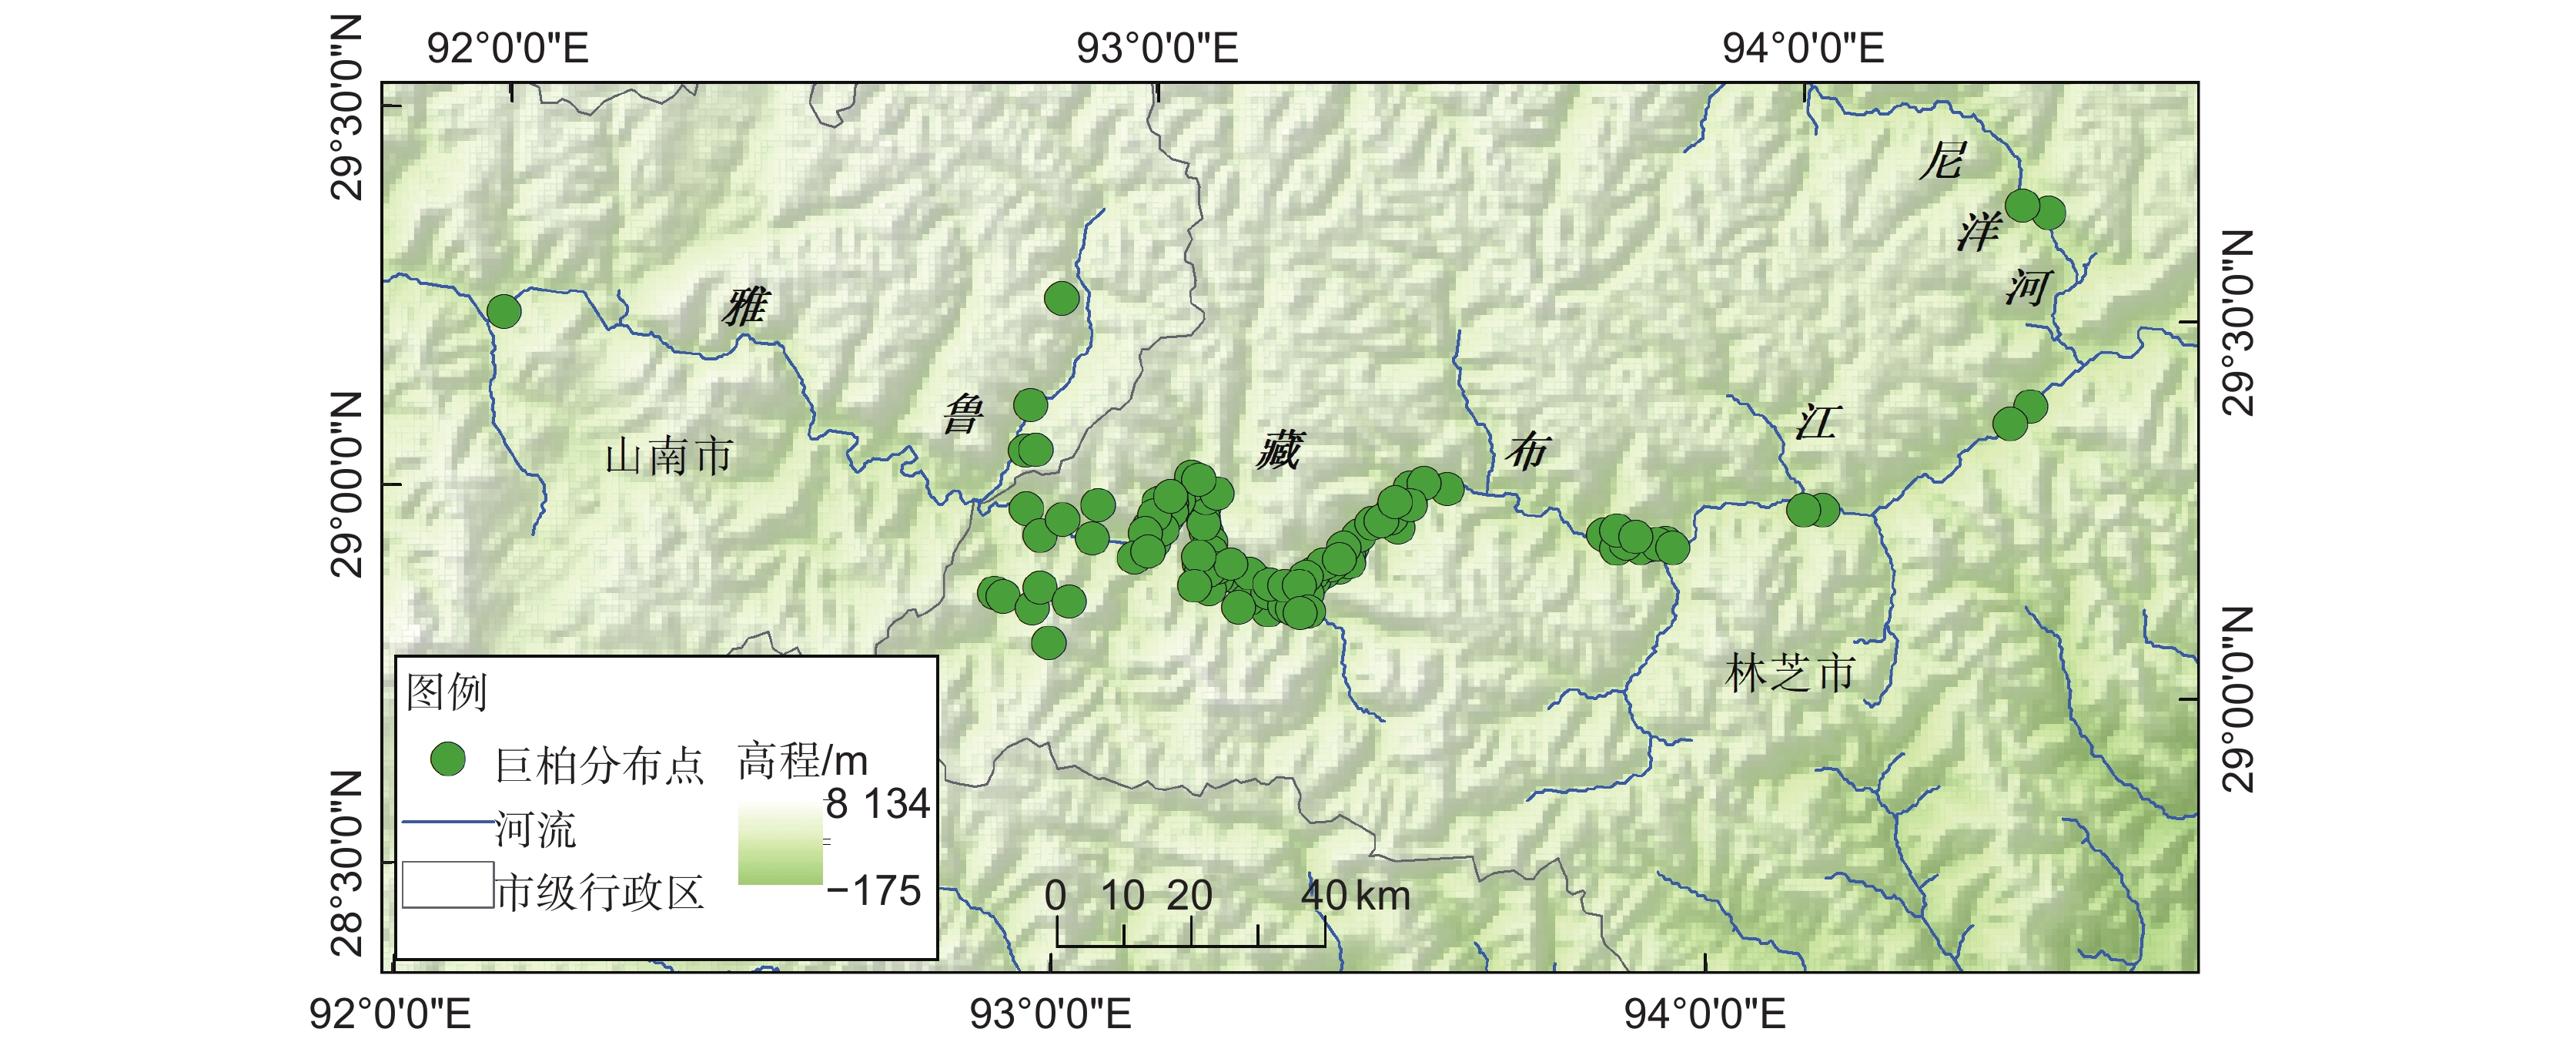
![]() Distribution map of selected sample points of Cupressus gigantea
Distribution map of selected sample points of Cupressus gigantea
-
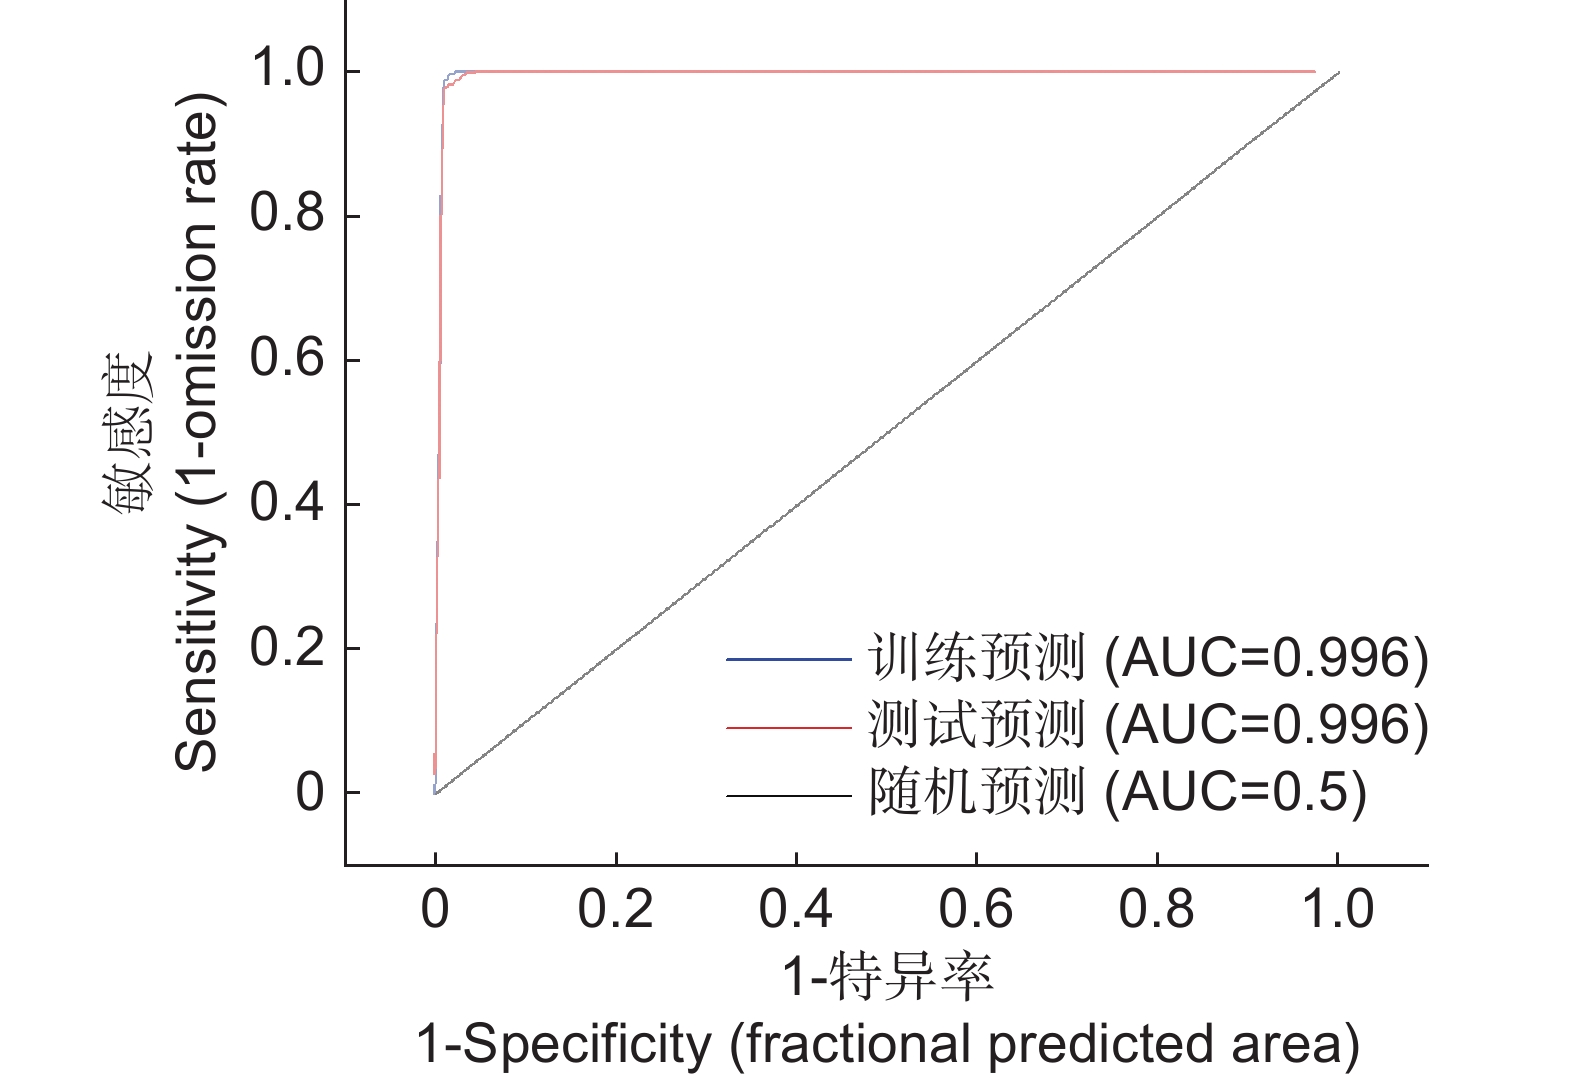
![]() Receiver operating curve (ROC) validation of final model
Receiver operating curve (ROC) validation of final model
-
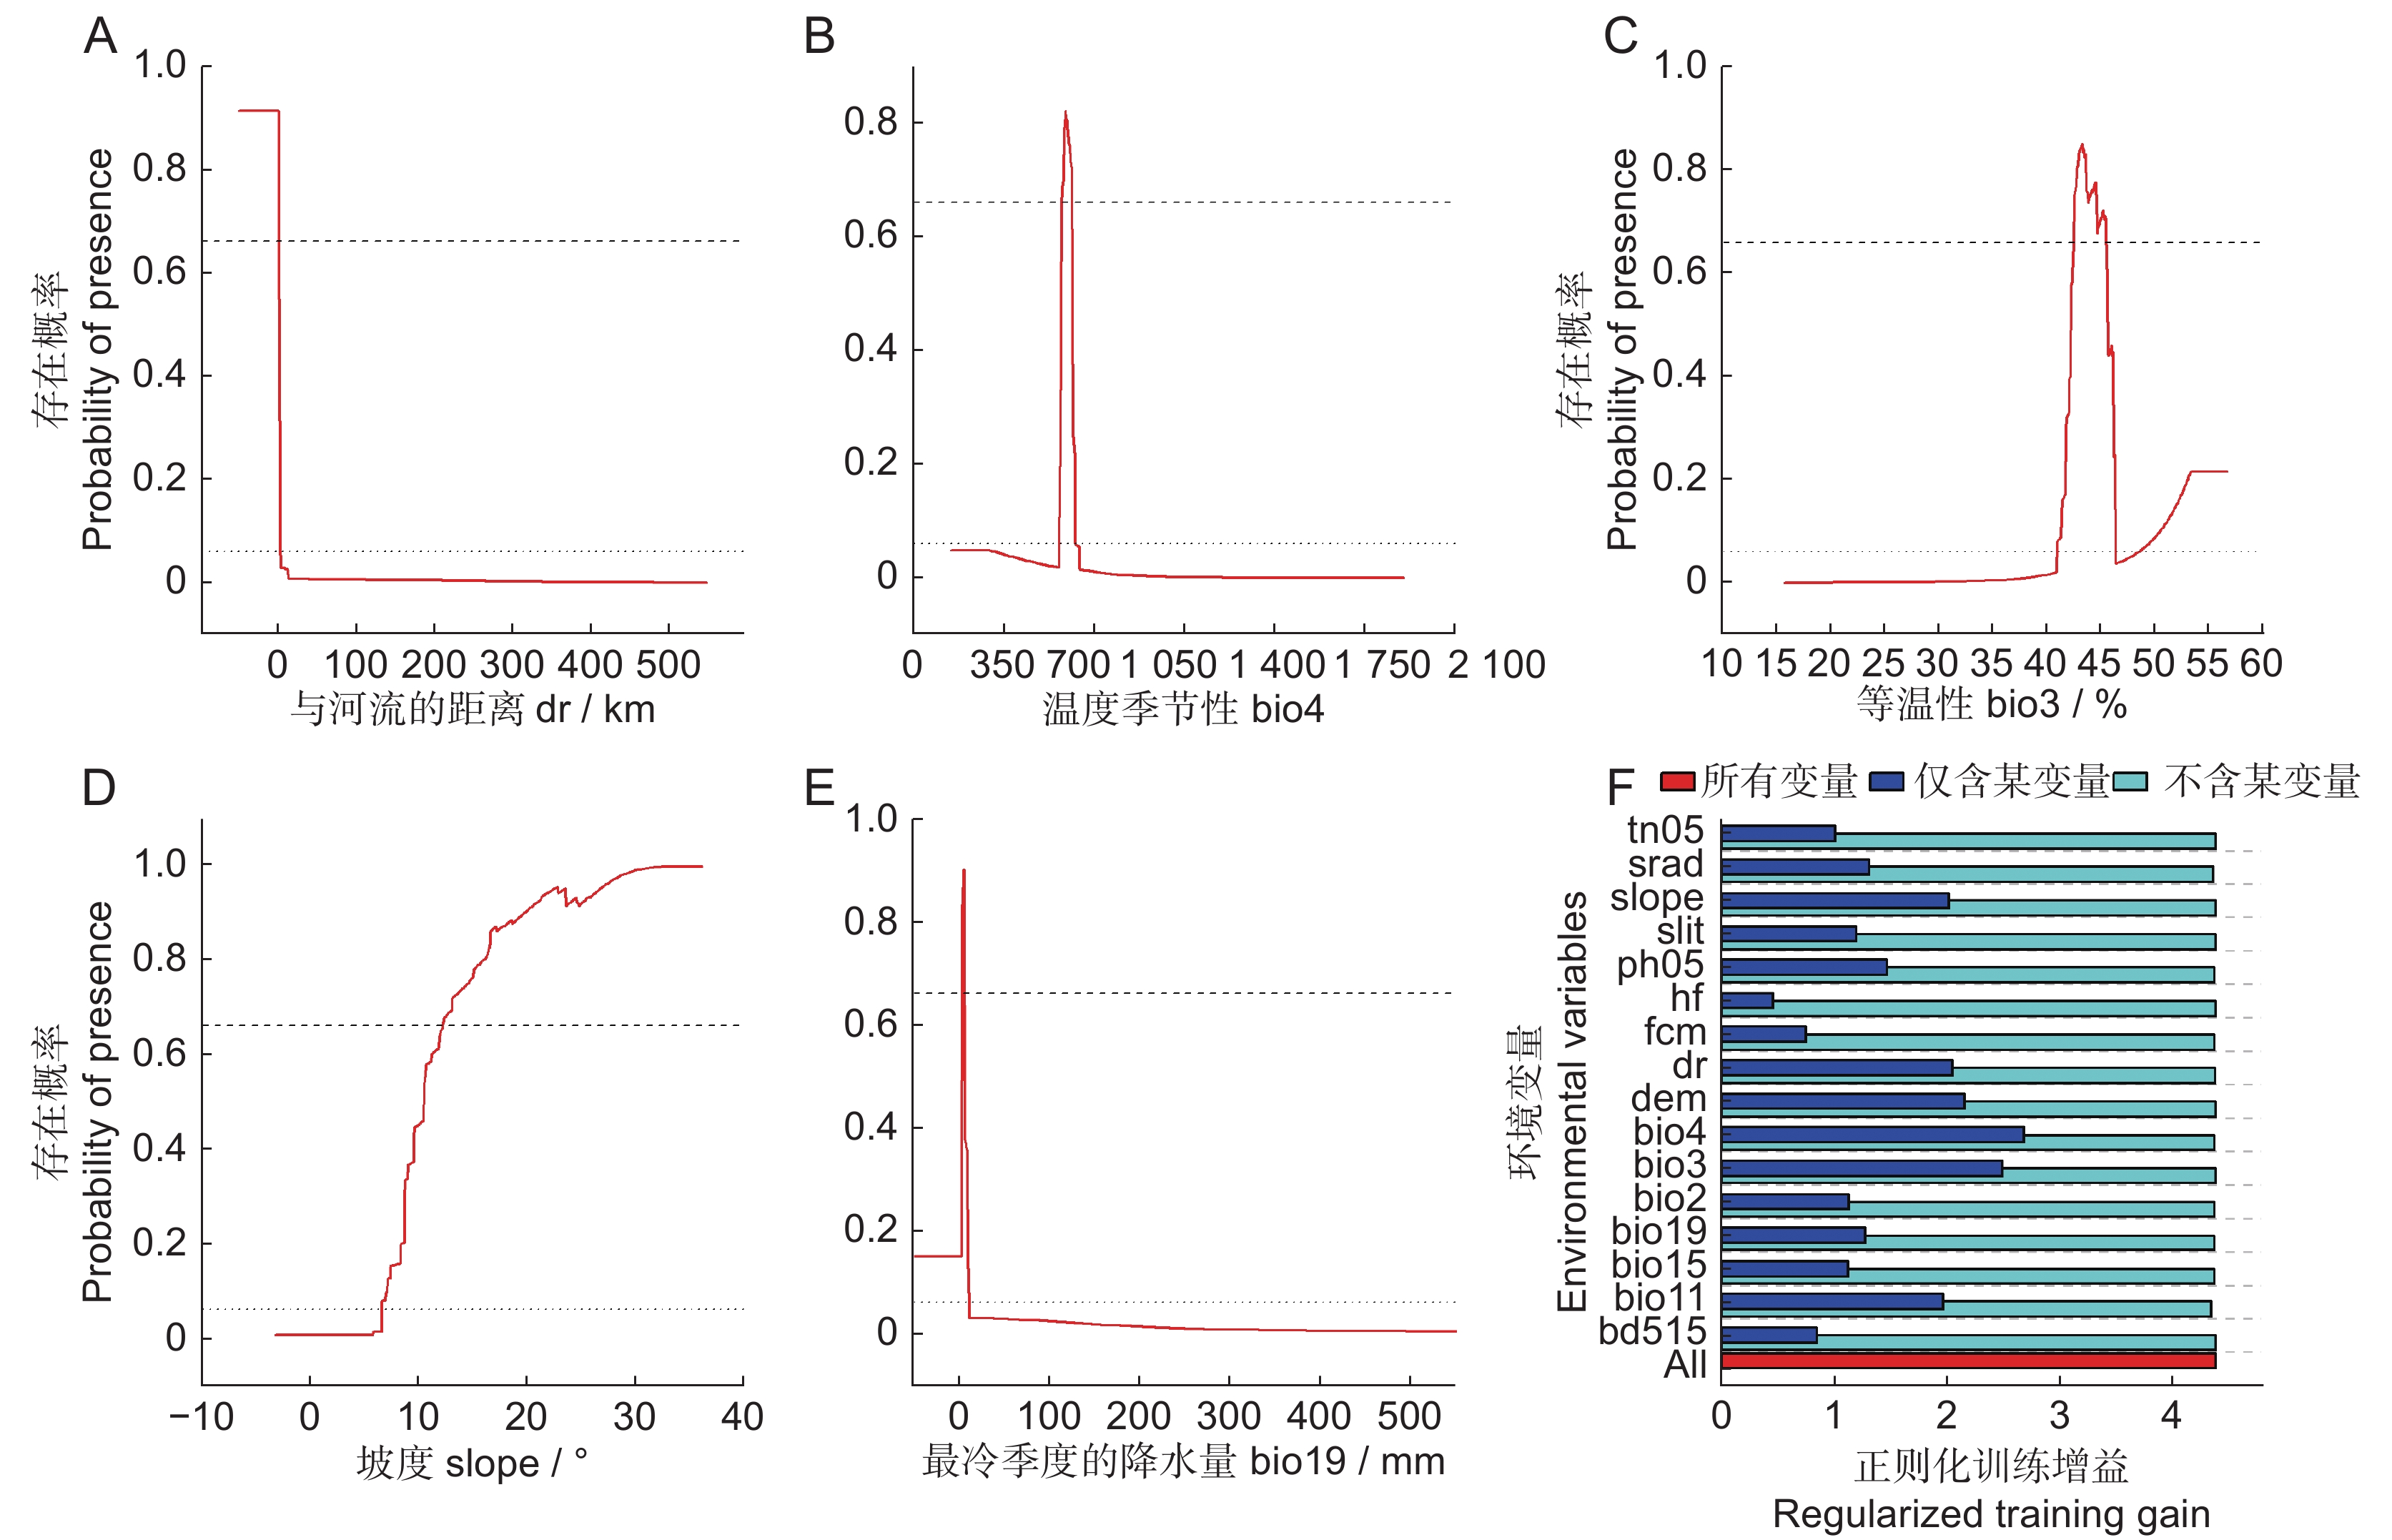
![]() Response curve diagram of dominant environmental variables (A–E) and importance of environmental variables affecting potential distribution of Cupressus gigantea based on Jackknife test (F)
Response curve diagram of dominant environmental variables (A–E) and importance of environmental variables affecting potential distribution of Cupressus gigantea based on Jackknife test (F)
-
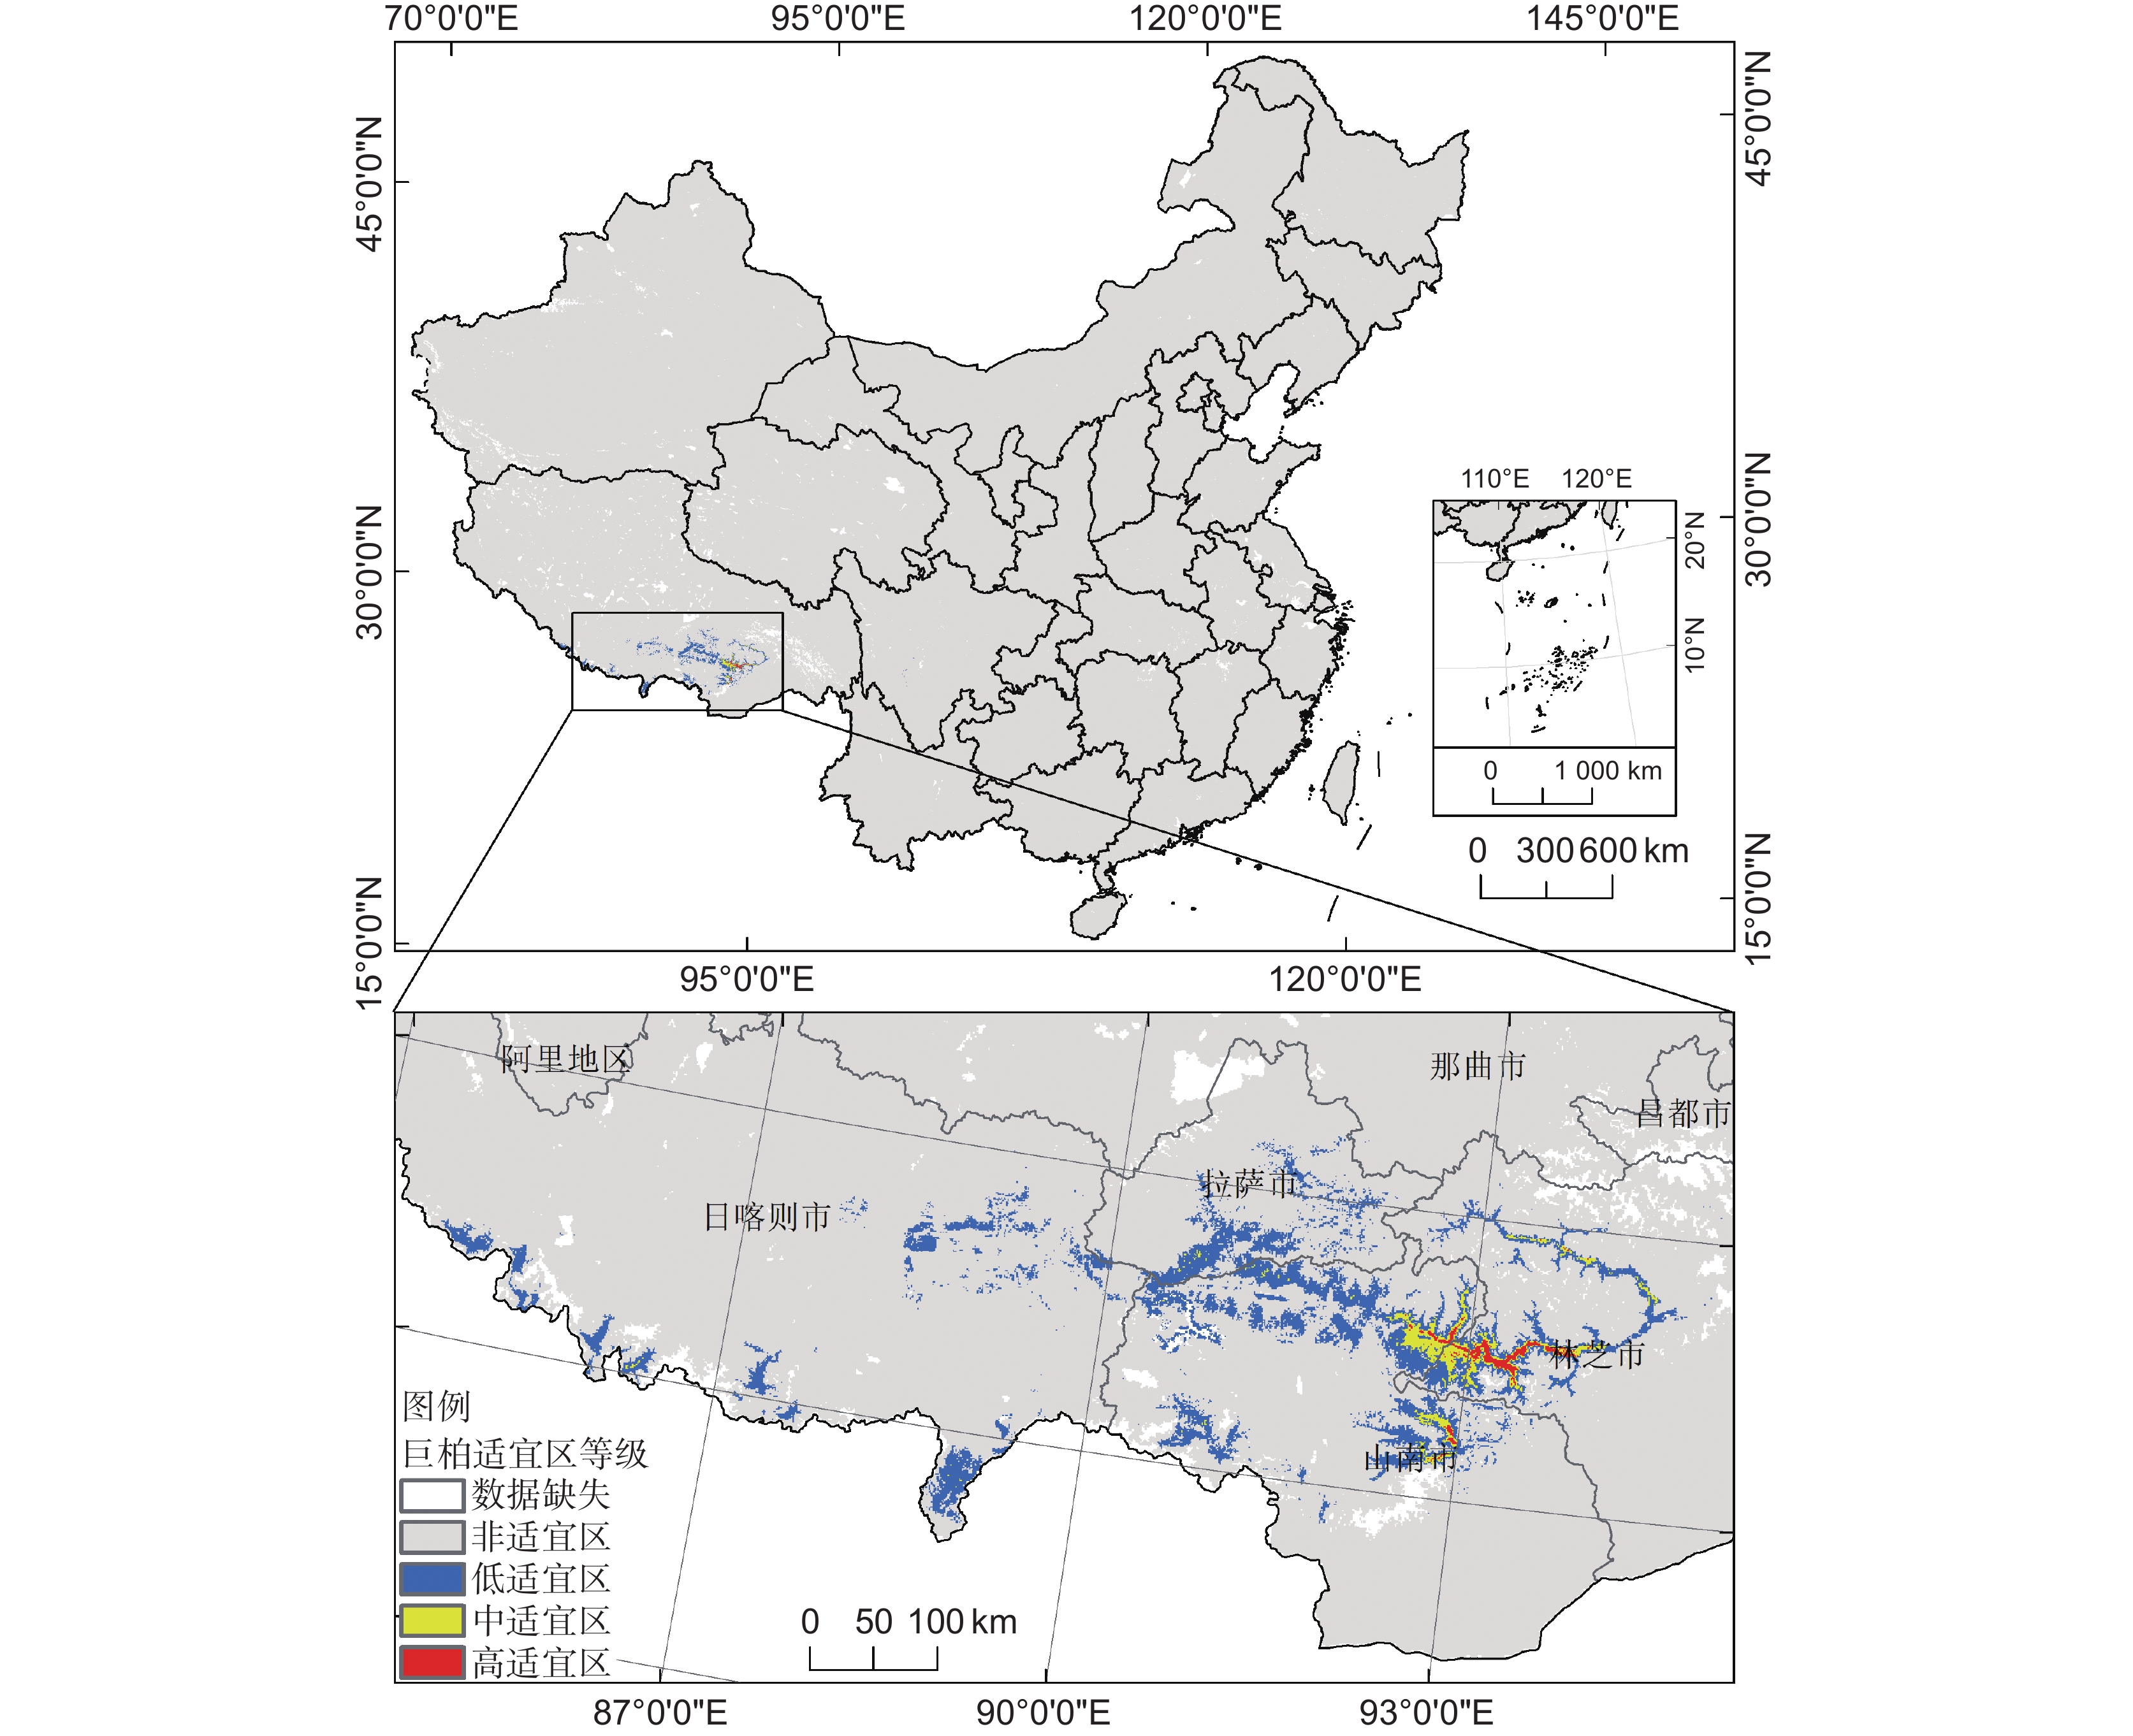
![]() Distribution of potential suitable habitats for Cupressus gigantea in China
Distribution of potential suitable habitats for Cupressus gigantea in China
Related articles
-
2023, 41(1): 44-52. DOI: 10.11913/PSJ.2095-0837.22112
-
2020, 38(4): 483-492. DOI: 10.11913/PSJ.2095-0837.2020.40483
-
2020, 38(3): 410-417. DOI: 10.11913/PSJ.2095-0837.2020.30410
-
2017, 35(3): 421-426. DOI: 10.11913/PSJ.2095-0837.2017.30421
-
2015, 33(2): 165-175. DOI: 10.11913/PSJ.2095-0837.2015.20165
-
2011, 29(3): 362-369.
-
2011, 29(2): 212-217.
-
2010, 28(1): 105-108.
-
2007, 25(3): 217-221.
-
1989, 7(4): 351-355.
