Figures of the Article
-
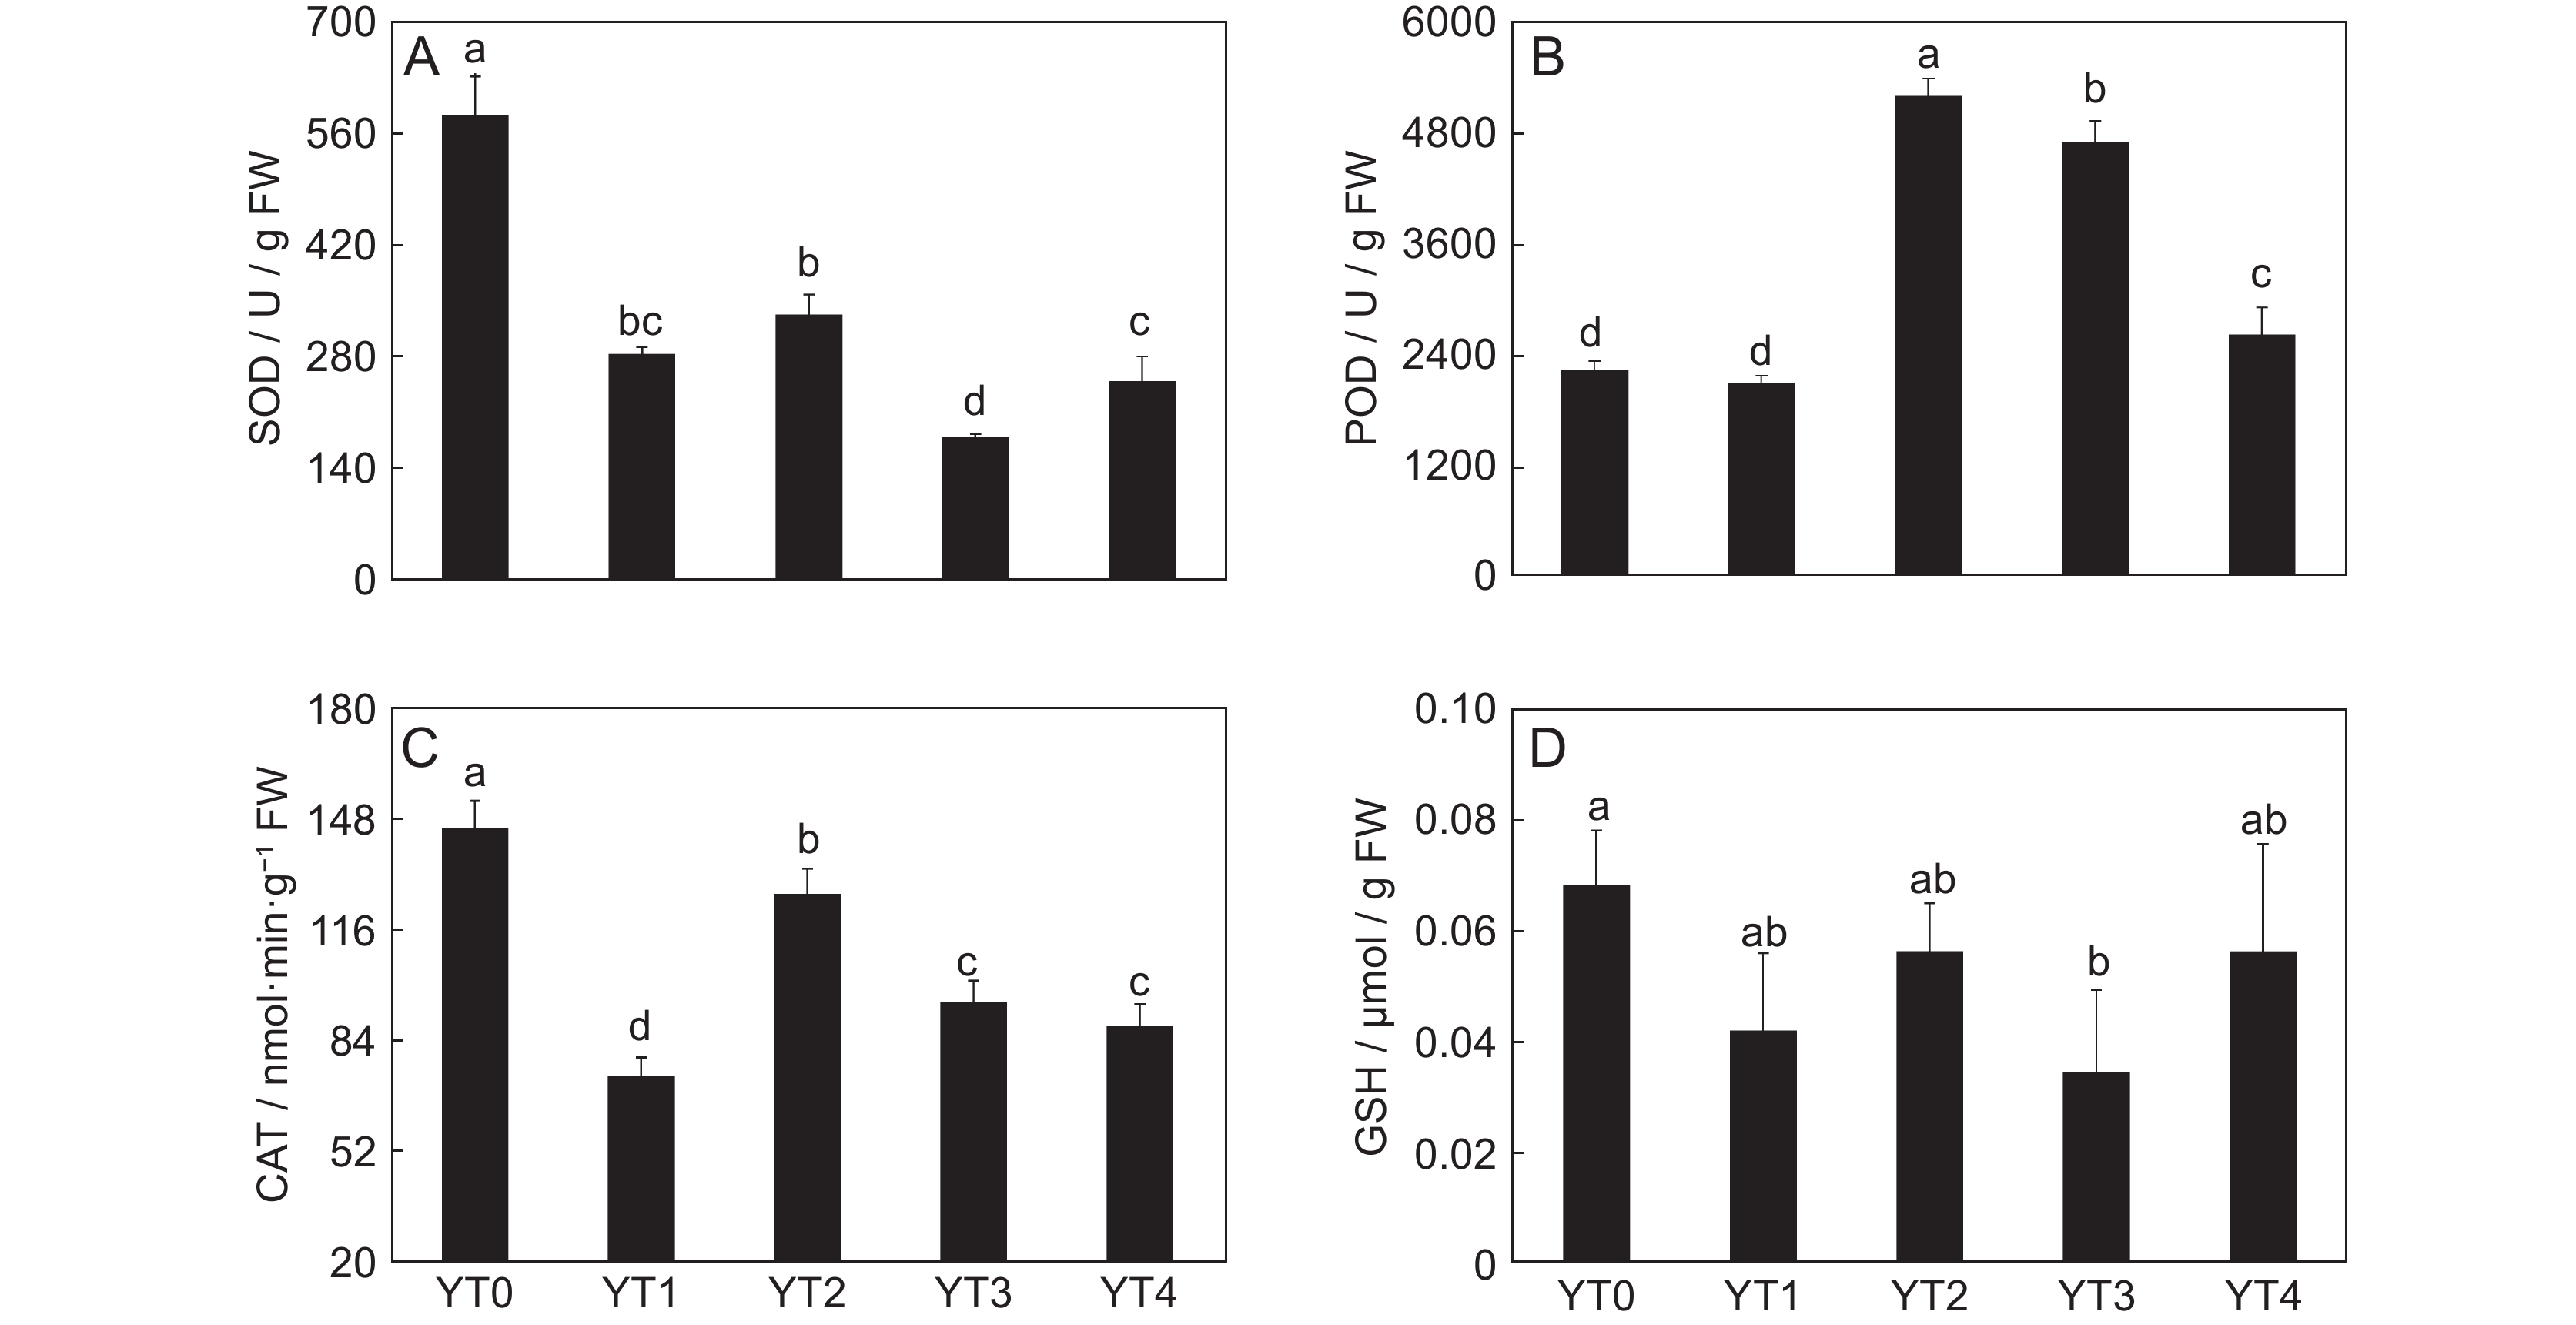
![]() Changes in SOD (A), POD (B), CAT (C), and GSH (D) in Plantago asiatica under Cd stress
Changes in SOD (A), POD (B), CAT (C), and GSH (D) in Plantago asiatica under Cd stress
-
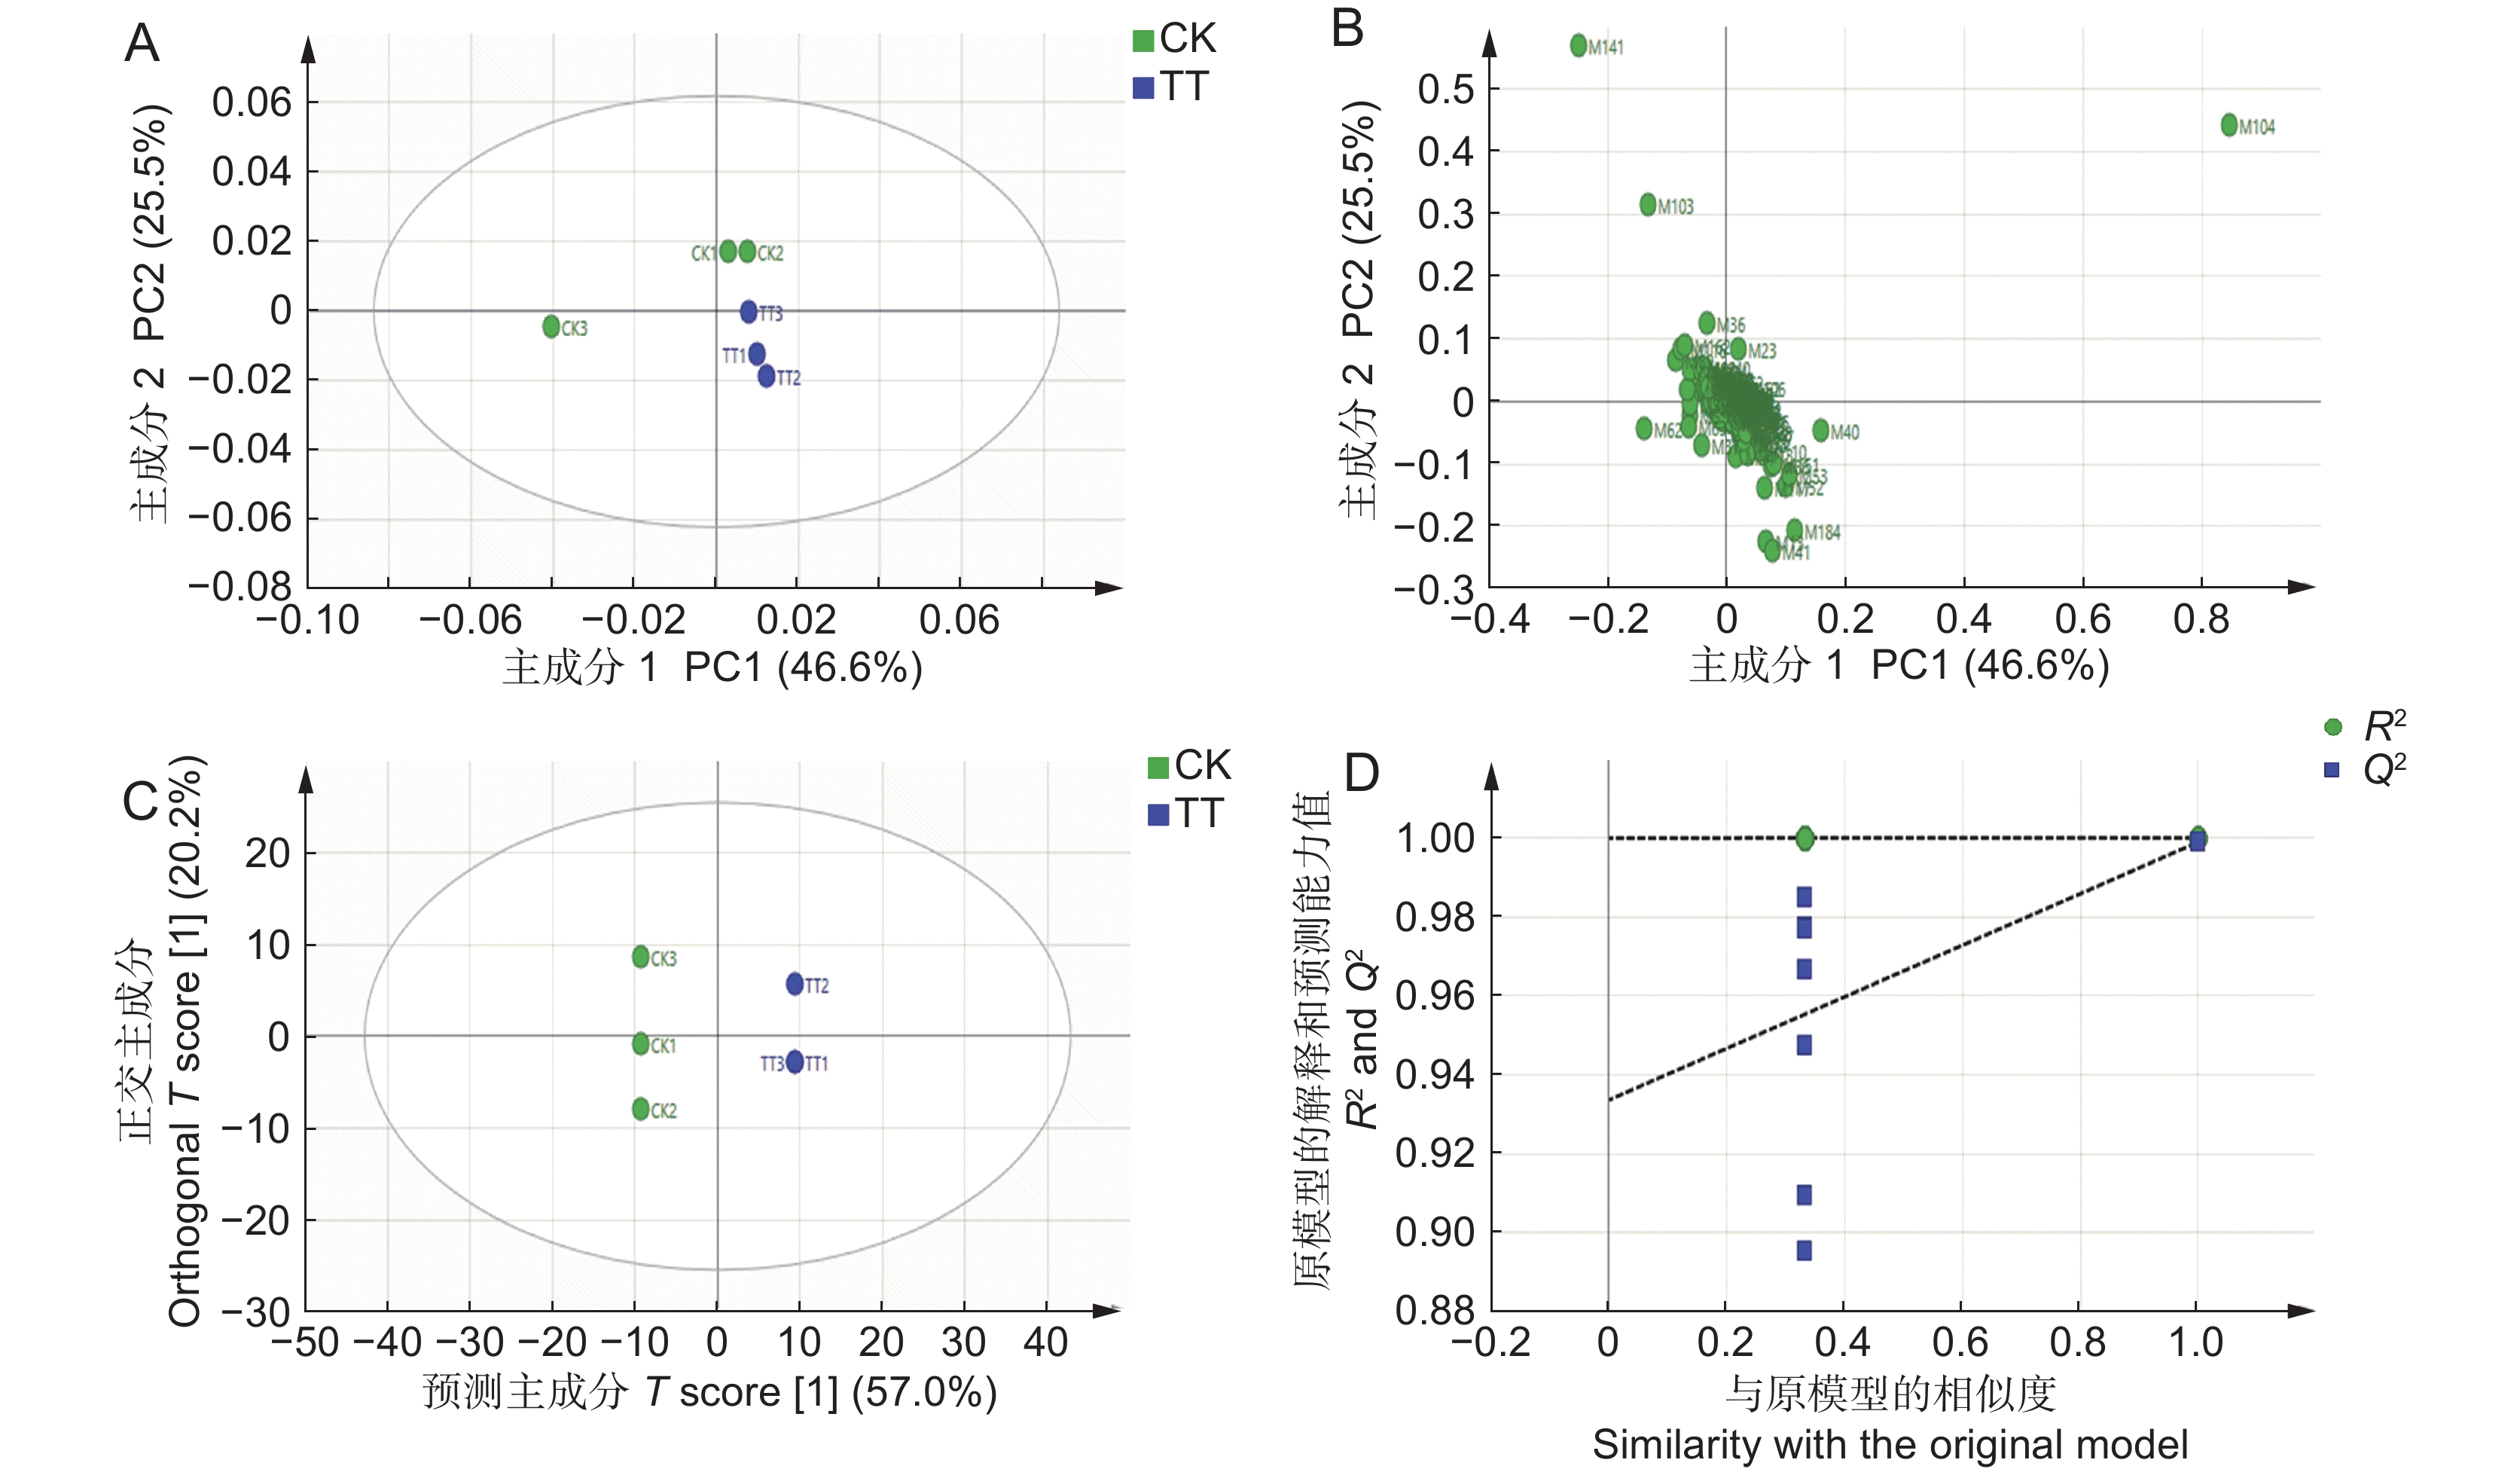
![]() Scatter plot of PCA scores (A), PCA load plot (B), scatter plot of OPLS-DA (C), and OPLS-DA model permutation test results (D)
Scatter plot of PCA scores (A), PCA load plot (B), scatter plot of OPLS-DA (C), and OPLS-DA model permutation test results (D)
-
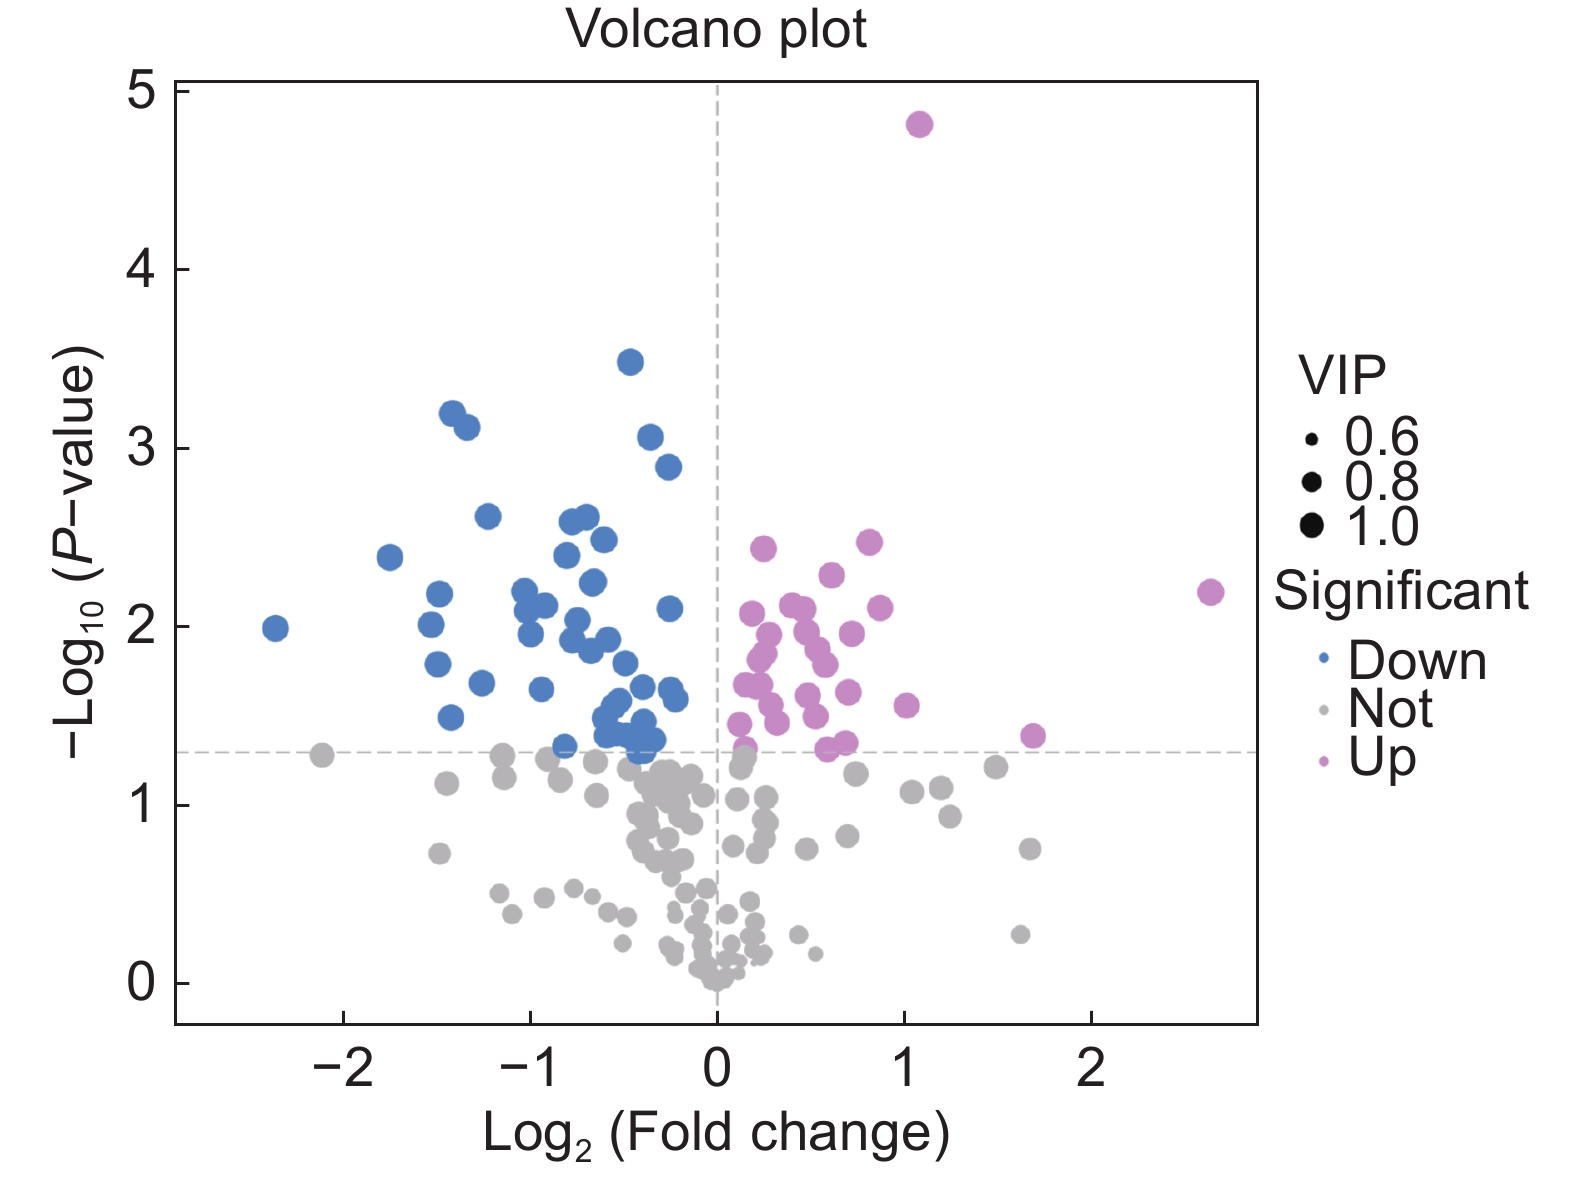
![]() Volcano plot for differential metabolites
Volcano plot for differential metabolites
-
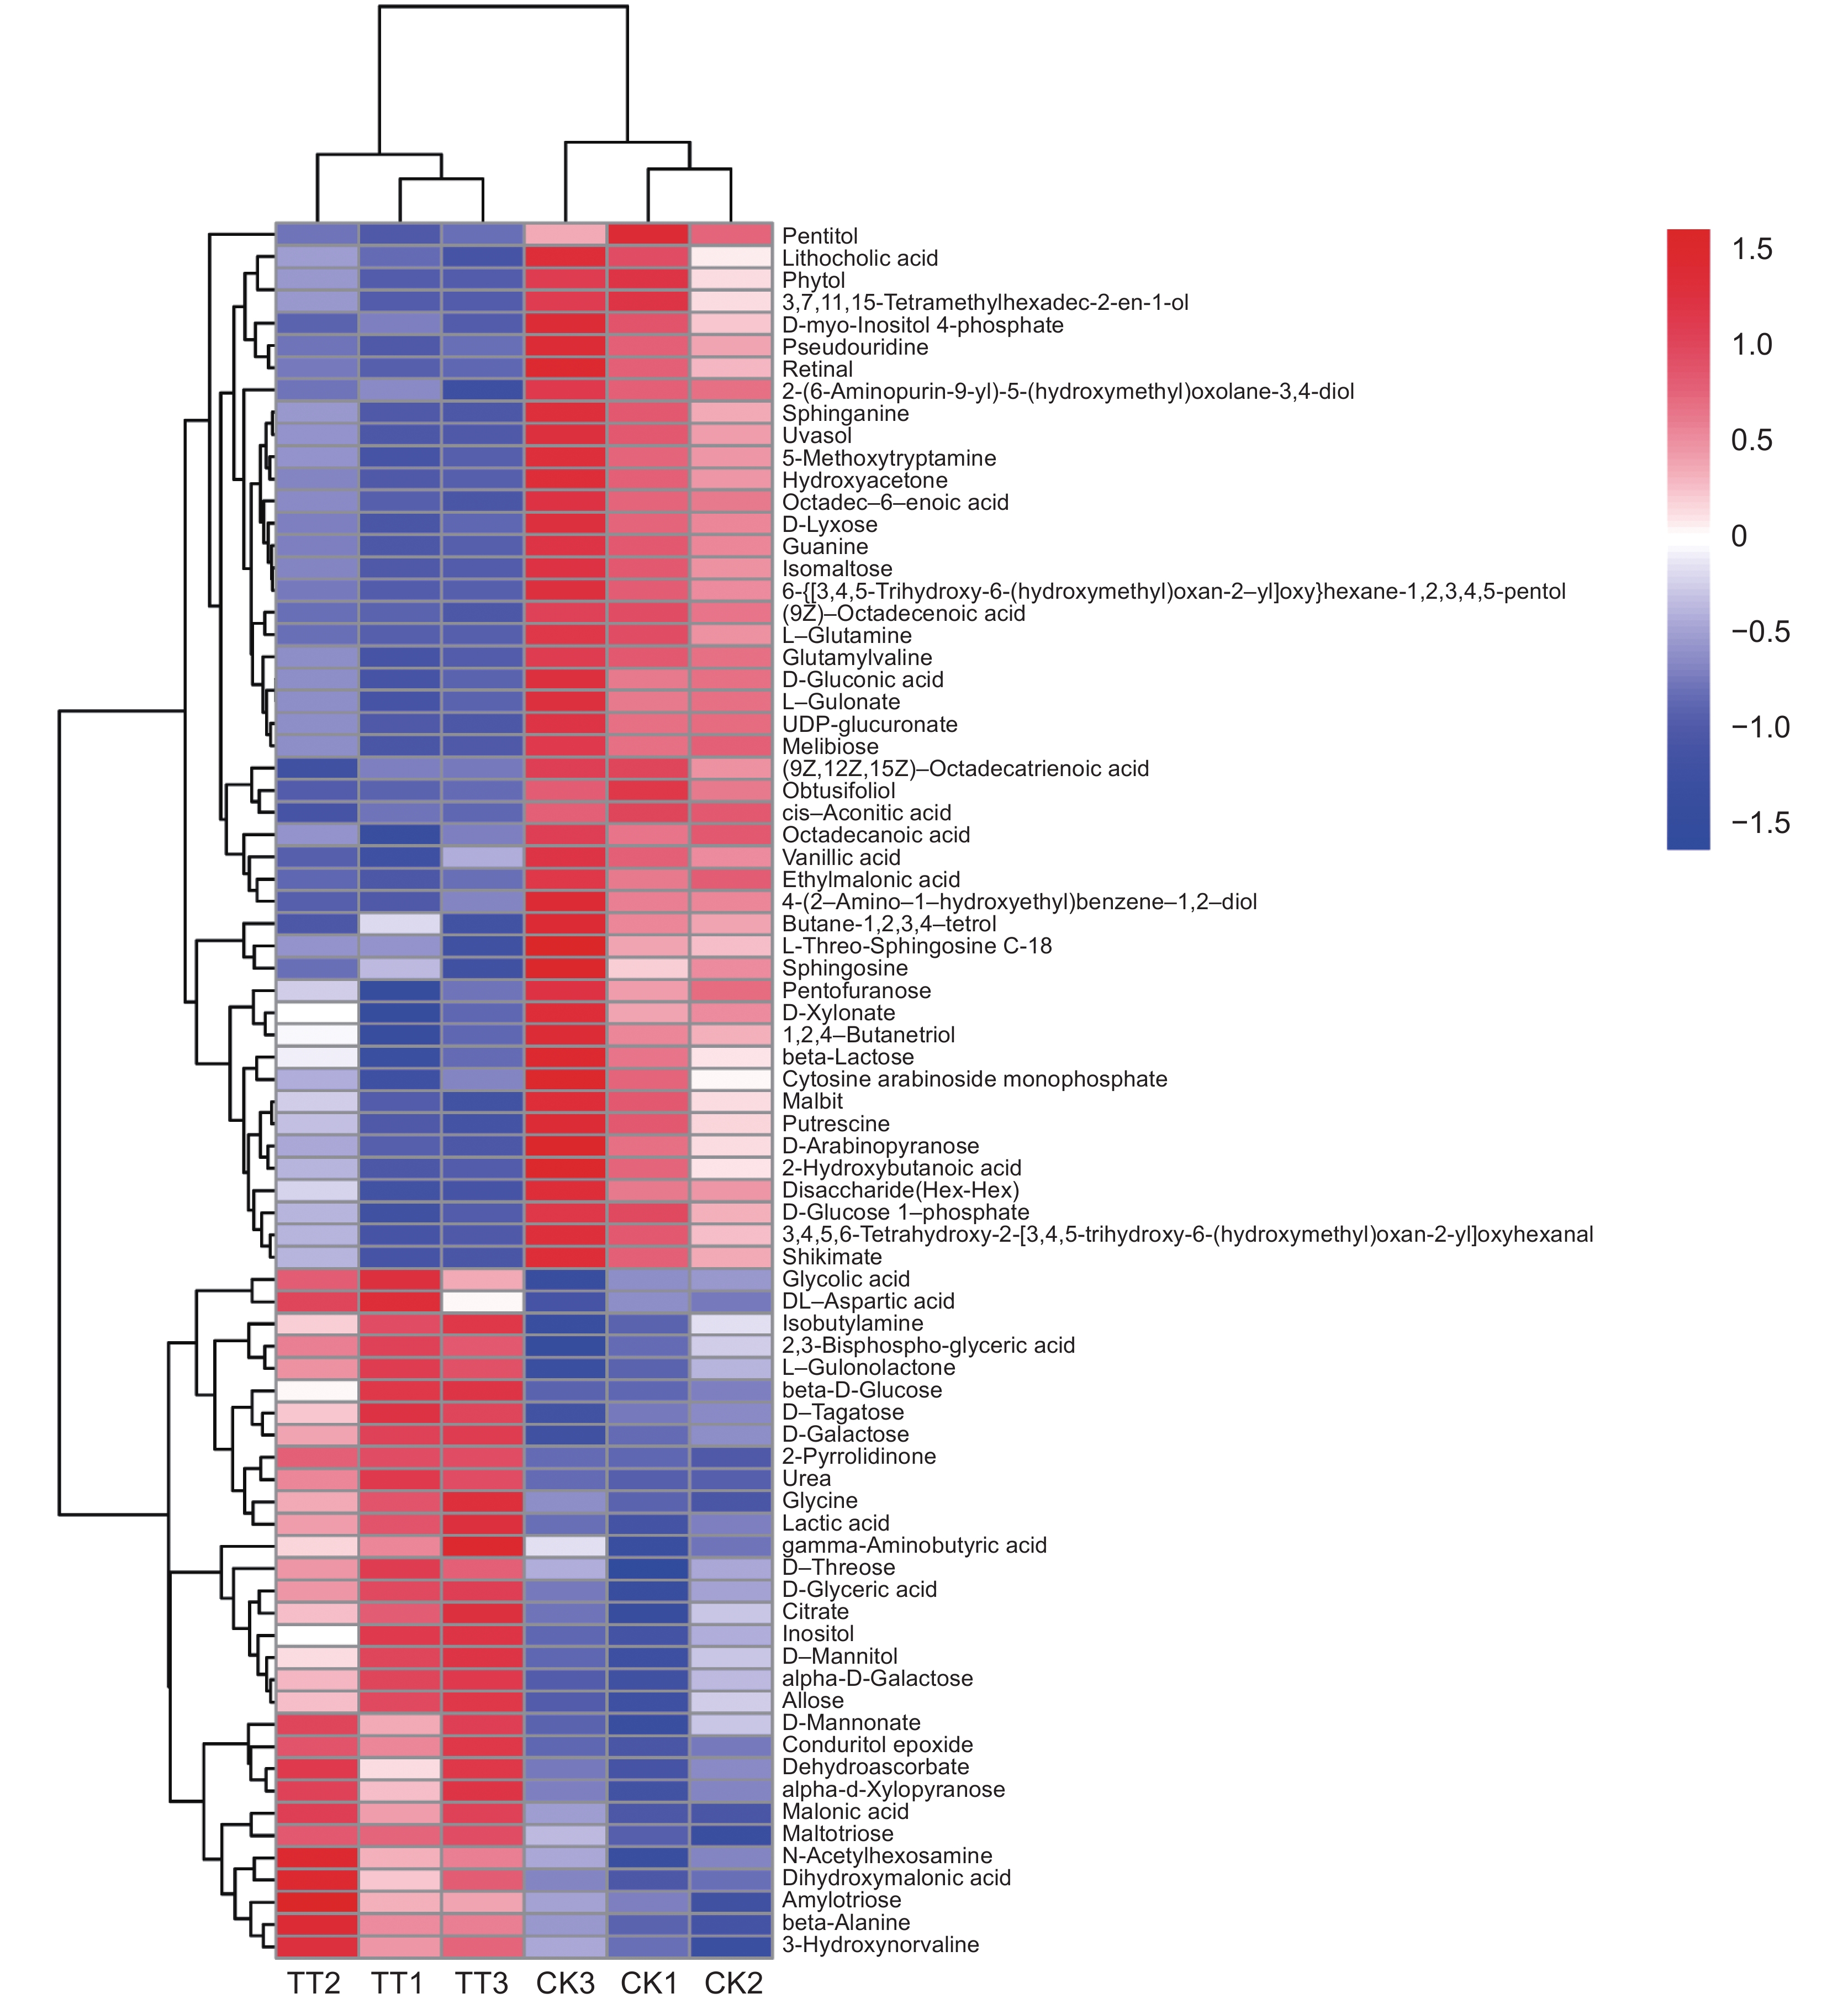
![]() Differential metabolite clustering heatmap
Differential metabolite clustering heatmap
-
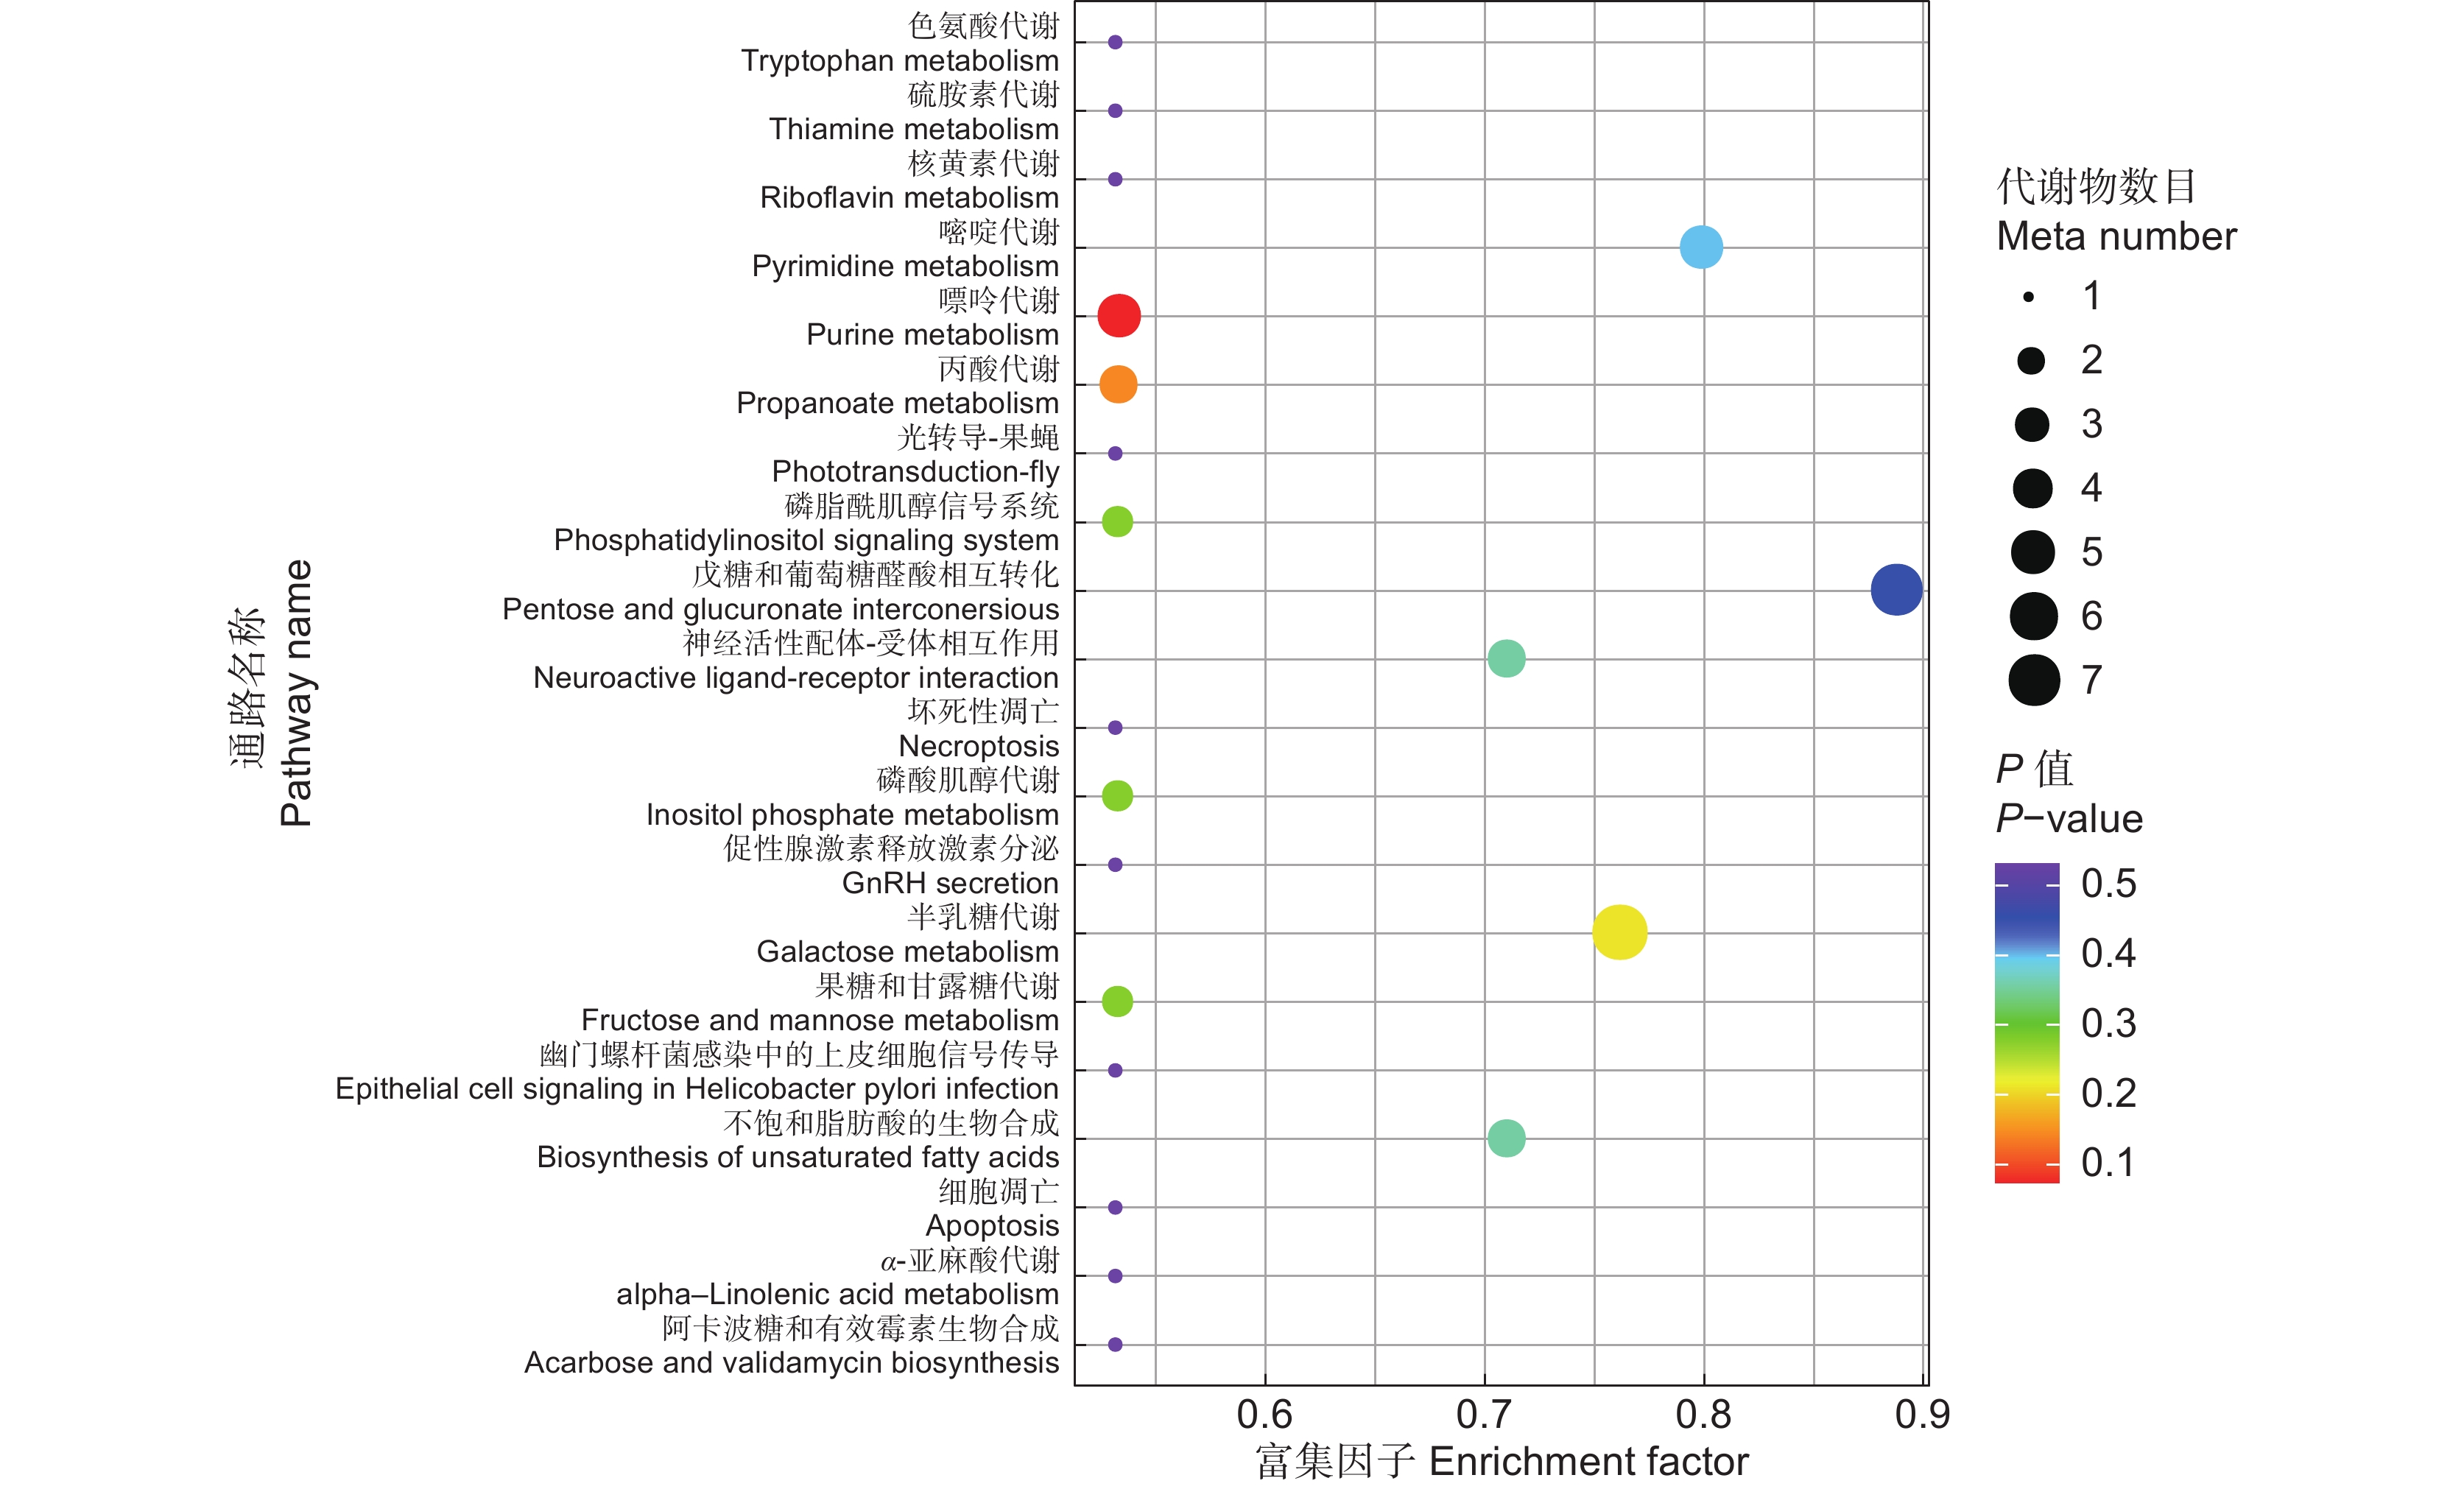
![]() Bubble diagram of differential metabolite pathways
Bubble diagram of differential metabolite pathways
Related articles
-
2025, 43(2): 230-241. DOI: 10.11913/PSJ.2095-0837.24104
-
2023, 41(2): 269-278. DOI: 10.11913/PSJ.2095-0837.22175
-
2022, 40(5): 705-713. DOI: 10.11913/PSJ.2095-0837.2022.50705
-
2022, 40(3): 408-417. DOI: 10.11913/PSJ.2095-0837.2022.30408
-
2019, 37(6): 808-819. DOI: 10.11913/PSJ.2095-0837.2019.60808
-
2018, 36(5): 767-773. DOI: 10.11913/PSJ.2095-0837.2018.50767
-
2018, 36(5): 755-760. DOI: 10.11913/PSJ.2095-0837.2018.50755
-
2017, 35(3): 398-405. DOI: 10.11913/PSJ.2095-0837.2017.30398
-
2006, 24(1): 87-89.
-
Comparative Research on Some Physiological Characteristics of Tobacco and Rape under Flooding Stress2002, 20(5): 395-398.


